Posts from February 2016 (31)

February 29, 2016

‘Cure’ exaggeration

A Herald headline says “Dementia cure just five years away – world expert“. That’s even worse than the Telegraph headline for the original piece “Dementia cure may be just five years away, says world expert“.

The ‘world expert’ is Dennis Gillings, an expert in clinical trials, who is the G8 ‘World Dementia Envoy’, so his opinions are worth listening to. What he says doesn’t really support the headline.

Dr Gillings… said progress was being made on treatments that might halt or reverse the progress of dementia, with some kind of brain training used to help rebuild lost neural pathways.

and

scientists increasingly believed it had been a mistake to treat dementia as one disease, saying it was likely that breakthroughs would come from targeting subtypes of the condition.

and

Saluting recent British investment in science, and the creation of a 150 million Dementia Research Institute, he said that, none the less, breakthroughs were more likely in the US, which put more money into research

If a cure was actually going to be available in five years you would have heard about its success in early clinical trials already. He’s talking about making scientific progress within five years to identify a cure, with breakthroughs still needed.

February 28, 2016

How I met your mother

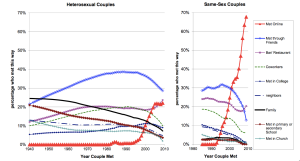
Via Jolisa Gracewood on Twitter, a graph from Stanford sociologist Michael Rosenfeld on how people met their partners (click to embiggen)

met

Obviously the proportion who met online has increased — in the old days there weren’t many people on line. It’s still dramatic how fast the change happened, considering that ‘the year September never ended’, when AOL subscribers gained access to Usenet, was only 1993.  It’s also notable how everything else except ‘in a bar or restaurant’ has gone down.

Since this is StatsChat you should be asking how they got the data: it was a reasonably good survey. There’s a research paper, too (PDF).

You should also be worrying about the bump in ‘online’ in the mid-1980s. It’s ok. The paper says “This bump corresponds to two respondents. These two respondents first met their partners in the 1980s without the assistance of the Internet, and then used the Internet to reconnect later”


Forecasts and betting

The StatsChat rugby predictions are pretty good, but not different enough from general educated opinion that you could make serious money betting with them.

By contrast, there’s a professor of political science who has an election forecasting model with a 97+% chance that Trump will be president if he is the Republican nominee.

If you were in the UK or NZ, and you actually believed this predicted probability, you could go to PaddyPower.com and bet at 9/4 on Trump winning  and at 3/1 on Rubio being the nominee. If you bet $3x on Trump and hedge with $1x on Rubio, you’ll almost certainly get your money back if Trump isn’t the nominee, and the prediction says you’ll have a 97% chance of more than doubling your money if he is.

Since I’m not betting like that, you can deduce I think the 97% chance is wildly inflated.

February 25, 2016

Thinking about chocolate

Q: Did you see that smart people like chocolate?

A: Isn’t it nice when studies confirm your prejudices? But that’s not what they’re claiming

Q: The headline says “Chocolate intake associated with better cognitive function”, doesn’t it?

A: Yes, but the story starts “Eating chocolate improves brain function, regardless of what else you’re scoffing, a study has found.” 

Q: That’s even better! How much did people’s brain function improve?

A: They don’t know

Q: It was mice?

A: No, it was people, but they only measured cognitive function once, so they couldn’t see any improvements.

Q: Ok, how much better was cognitive function in the people given chocolate?

A: No-one was given chocolate; these were free-range participants in a longitudinal study

Q: So at least they measured chocolate intake over time and then looked at cognitive function later on?

A: Sadly, no.

Q: But the story says it was a rigorous study.

A: Yes. Yes it does.

Q: And I suppose the alleged effects of chocolate are really small, right?

A: If the cognitive function score was scaled like IQ, it would be about 3 IQ points.

Q: That’s not tiny

A: Indeed. Especially when you consider that they didn’t measure how much chocolate people ate or what type of chocolate or how much it had of the flavonols they think are responsible. They just divided people into eating chocolate less than once/week, once/week, and more than once/week.

Q: Aren’t flavonols in other things, too?

A: Yes: tea, red wine, a bunch of other favourites for this sort of story

Q: So if it really was flavonols, the true effect must be huge

A: Yes. So it probably isn’t.

Q: What does the research paper say about the cause-effect relationship?

A: “This precludes any conclusions regarding a causal relationship between chocolate intake and cognition from being drawn.”

Q: Ok. That makes sense.

A: On the other hand, they say “It is evident that nutrients in foods exert differential effects on the brain. As has been repeatedly demonstrated, isolating these nutrients and foods enables the formation of dietary interventions to optimise neuropsychological health.”

Q: “Repeatedly demonstrated” that you can give people diets or supplements to make their brains better? Isn’t that the sort of claim where “Name three” is the appropriate response?

A: Pretty much.

February 24, 2016

Super 18 Predictions for Round 1

Team Ratings for Round 1

The basic method is described on my Department home page.

Here are the team ratings prior to this week’s games, along with the ratings at the start of the season.

Current Rating Rating at Season Start Difference
Crusaders 9.84 9.84 0.00
Hurricanes 7.26 7.26 0.00
Highlanders 6.80 6.80 0.00
Waratahs 4.88 4.88 0.00
Brumbies 3.15 3.15 0.00
Chiefs 2.68 2.68 0.00
Stormers -0.62 -0.62 0.00
Bulls -0.74 -0.74 -0.00
Sharks -1.64 -1.64 0.00
Lions -1.80 -1.80 0.00
Blues -5.51 -5.51 -0.00
Rebels -6.33 -6.33 0.00
Force -8.43 -8.43 0.00
Cheetahs -9.27 -9.27 0.00
Reds -9.81 -9.81 0.00
Jaguares -10.00 -10.00 0.00
Sunwolves -10.00 -10.00 0.00
Kings -13.66 -13.66 0.00


Predictions for Round 1

Here are the predictions for Round 1. The prediction is my estimated expected points difference with a positive margin being a win to the home team, and a negative margin a win to the away team.

Game Date Winner Prediction
1 Blues vs. Highlanders Feb 26 Highlanders -8.80
2 Brumbies vs. Hurricanes Feb 26 Hurricanes -0.10
3 Cheetahs vs. Jaguares Feb 26 Cheetahs 4.70
4 Sunwolves vs. Lions Feb 27 Lions -4.20
5 Crusaders vs. Chiefs Feb 27 Crusaders 10.70
6 Waratahs vs. Reds Feb 27 Waratahs 18.20
7 Force vs. Rebels Feb 27 Force 1.40
8 Kings vs. Sharks Feb 27 Sharks -8.50
9 Stormers vs. Bulls Feb 27 Stormers 3.60


Home ownership comparisons

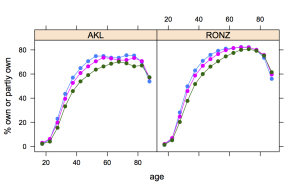
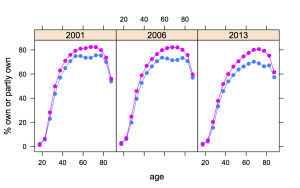
Two graphs to help people on Twitter who are arguing about home ownership trends in Auckland vs rest of NZ or in generational differences.

Both are percentages of home ownership based on the census question “Do you own or partly own your home?”, with data from the last three censuses.

First, comparisons between Auckland and the Rest of NZ by age, over time. Blue is Auckland, pink is RONZ

tenure-1

Second, trends over 12 years, by age, for three census years. Blue is 2001, pink is 2006, green is 2013.

tenure-2

Data from the nzdotstat table “Tenure holder by age group and sex, for the census usually resident population count aged 15 years and over, 2001, 2006 and 2013 Censuses (RC, TA, AU)”


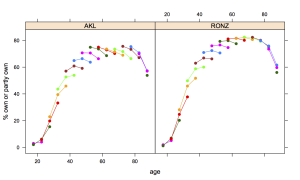
Update: And one more. Here the lines connect roughly the same group of people (birth cohort) over time (only approximately because the planned 2011 census didn’t happen until 2013).

tenure-3

Briefly

  • Places“:  Interactive maps of place name distribution in the US. For example “Lake” — with high density in the “Land of Lakes” but also in some less-expected placesplaces
  • “Spreadsheets, the original analytics dashboard’, from Simply Statistics, about the origin of spreadsheets and what they were good for.
  • Cats can see the ‘rotating snake’ optical illusion: video evidence from Rasmus Bååth
  • As we’ve mentioned before, most people think teenagers have more risky behaviours now than in the Good Old Days. Most people are wrong. This time, from Vox.
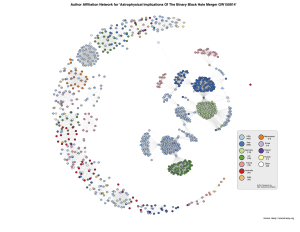
  • From Kieran Healy, the network of shared institutional affiliations for the 1000+ authors of the LIGO gravitational waves paper (click to embiggen). That is, many scientists have some sort of connection with more than one university; the graph shows how these link up the LIGO researchers.
    person-bp-edit
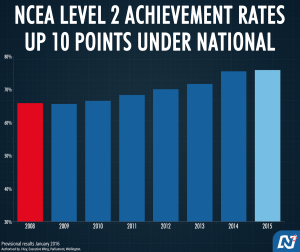
  • Come on, major political parties. Barchart axes start at zero unless you want to look like Fox News. There are reasons for this. If you don’t want to start the axis at zero use some other sort of chart.
    Cb3nqizUYAAnkgu
February 23, 2016

Population density: drawing the lines

David Seymour, on the Herald website

 Auckland is already denser than New York, and most American and Australian cities.  The 1.6 million people in Manhattan may live cheek-by-jowl, but not the other 20 million inhabiting the wider urban area.

An intelligent politician wouldn’t say something as apparently bizarre as this first sentence if it wasn’t true, so of course it is. The question is going to be true in what sense?

Based on the population figure, Mr Seymour is talking about the New York Metropolitan Statistical Area, aka, New York Urban Area,  which has a population of 20.1 million and a population density of 724/km2[*]. The Auckland Urban Area has a population of 1.45 million and a density of 2,600/km2, and, yes, 2600 is larger than 724. However, as the scenic photos in the Wikipedia page for the New York Metropolitan Area suggest, that might not be a fair comparison.

In fact, it’s true almost by definition that the New York metropolitan area has a lower density than urban Auckland

Urban areas in the United States are defined by the U.S. Census Bureau as contiguous census block groups with a population density of at least 1,000/sq mi (390/km2) with any census block groups around this core having a density of at least 500/sq mi (190/km2).  [Wikipedia, or see full legal definition]

That is, the metropolitan area is defined as the area around New York City all the way out until the local population density is below 190/km2It’s a sensible statistical unit — the US Census Bureau wasn’t trying to make a political point about urban infill when they defined it — but it’s not the same sort of unit as Stats New Zealand’s definition of urban or metro Auckland.

So, what other comparisons could we do? We could compare the New York Metropolitan Area to the Auckland Supercity, whose population density of 320/km2 is less than half as high. That might be unfair in the other direction — the Supercity is designed with the future expansion of Auckland in mind, while the US definitions are only intended for a ten-year period between censuses.

We can’t quite do the perfect comparison of redrawing Auckland Urban Area by the US rules, because NZ Area Units are bigger than US Census Block Groups, and NZ meshblocks are smaller, but someone with more time than me could try.

We could compare the Auckland urban area to genuinely urban parts of  the New York metro:  Mr Seymour mentioned Manhattan (density 27,673/km2, three times that of the Auckland CBD, nine times that of the Epsom electorate) but the other four boroughs of New York City all have higher density than urban Auckland. Two of them (the Bronx, and Brooklyn) have higher density than the Auckland CBD, Queens (8237/km2) is closer in density to the Auckland CBD than to the rest of Auckland, and even Staten Island is denser than urban Auckland as a whole. In the metropolitan area but across the river from New York City proper we have Hudson County (density 5,241/km2) and Newark (density about 4500/km2). The whole of Long Island, part of the New York metropolitan area, but also known for places like Fire Island and the Hamptons, has population density 2,151/km2, not far below urban Auckland.

And finally, an alternative way to do this whole comparison, which is much less sensitive to where the lines are drawn, is to look at population-weighted densities. That is, for the average person in a city, how dense is the population near them? For the whole New York metropolitan area the population-weighted density is 12000/km2 (or 120/hectare). For Auckland it is 43/hectare. In other words, while people near the edges of the New York metro area have a lot of space, most New Yorkers don’t. The average person in the broad New York metropolitan area sees three times the local population density of the average Aucklander.


Update: * Mr Seymour tells me he was referring the the definition of metropolitan areas from Demographia, which trims some of the low-density parts of the Census Bureau definition of New York to give a population density of 1800, and agrees well with the StatsNZ definition of urban Auckland.  So, while the issue about the difficult in defining things comparably is still an issue, it is less his fault than I had assumed.
February 21, 2016

Crushing and crashing

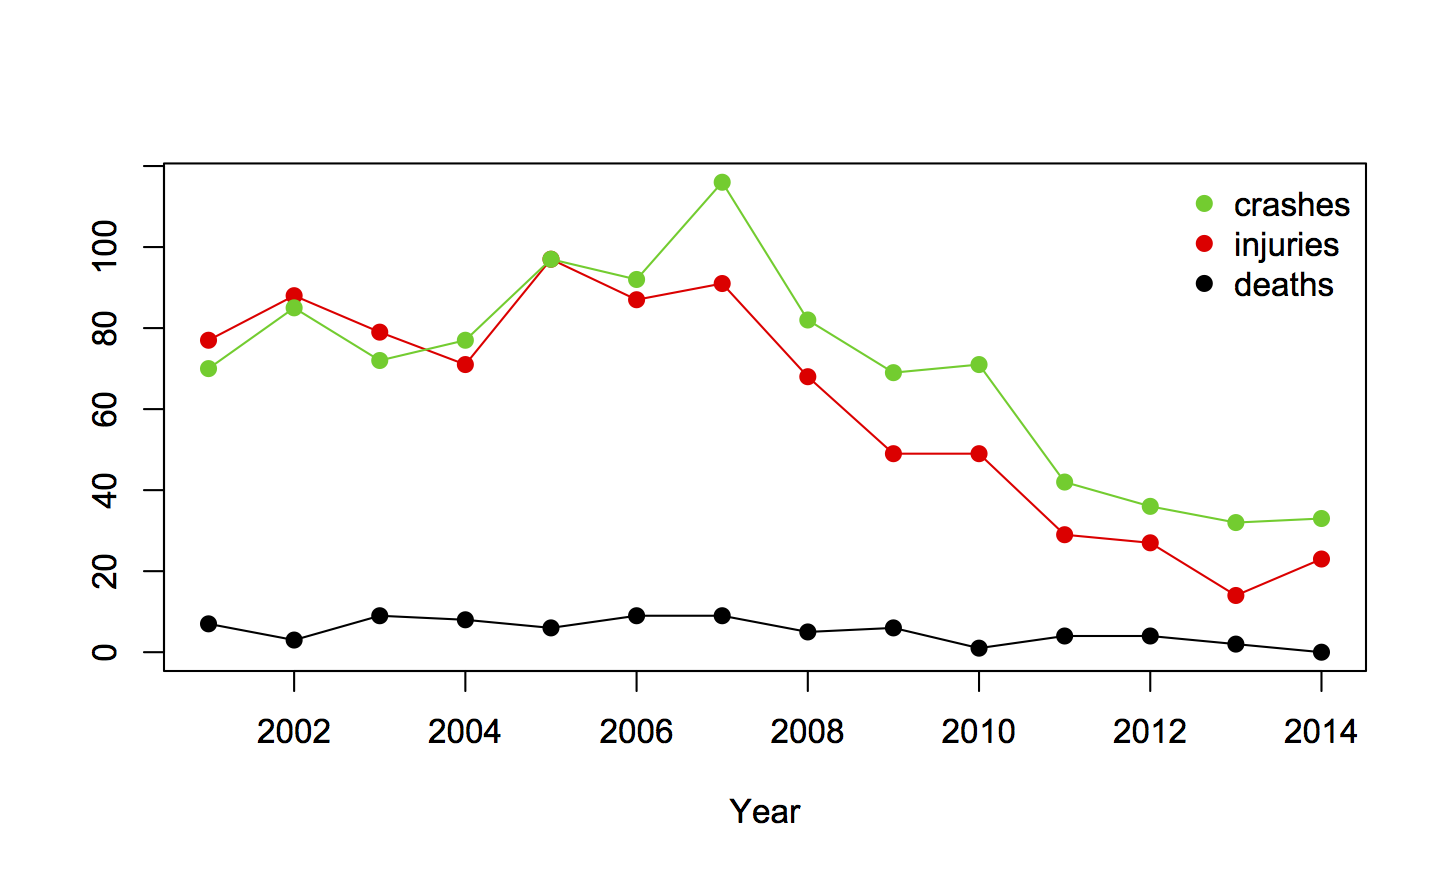
The Herald saysPolice Minister Judith Collins has released figures to show crushing boy racers’ cars has worked“.  The data are more consistent with the political interpretation than is usual for claims about crashes, but not as strong as the Minister would like us to think.

Here’s a graph of the data (supplied to the Herald by the Minister’s office), showing crashes, injuries, and deaths where the police reported ‘racing’ as a cause:

crusher

It’s fairly clear that something changed. Based purely on the graph you’d say the downwards trend started after 2007; 2009 isn’t unreasonable, but it fits the data a bit less well. This an example of a graph being much more useful than a table.

The next thing to check is other crashes — the road toll has been down in recent years, so this could just have been a general improvement. It’s not; the evidence for a change is a little weaker when considering racing deaths or injuries as a proportion of all fatal or injury crashes, but it’s still there.

In principle there could have been changes in reporting, but it’s hard to see how a government crackdown would make police less likely to report ‘racing’ involvement in a crash.

Finally, there’s publication bias.  The reporter, Nicholas Jones, didn’t notice that Ms Collins was back and decide to pull figures on car crushing; the Minister decided to release the figures. She wouldn’t have done that if they didn’t look favourable. It’s hard to tell how much to discount the evidence for that, but a discount is needed.

Overall, the data are definitely consistent with a deterrent effect of car crushing, but the evidence isn’t all that strong — the best fit to the data suggests things changed earlier than 2009, and looking at the numbers was the Minister’s idea, not the reporter’s.


Updates:

  • in addition to the useful comments, I’ve been pointed to Dog & Lemon where Clive Matthew-Wilson says there is reason to believe the ‘boy racer’ thing was already going away on its own.  If so, that would fit the trend starting earlier than the legislation.
  • If you check the crash numbers against the Road Crash Statistics system they don’t match.  I think that’s because Table 26 of the Road Crash Statistics only includes crashes causing injury or death — that’s explicit in the 2012 spreadsheet, and I think it’s still true.

Evils of axis

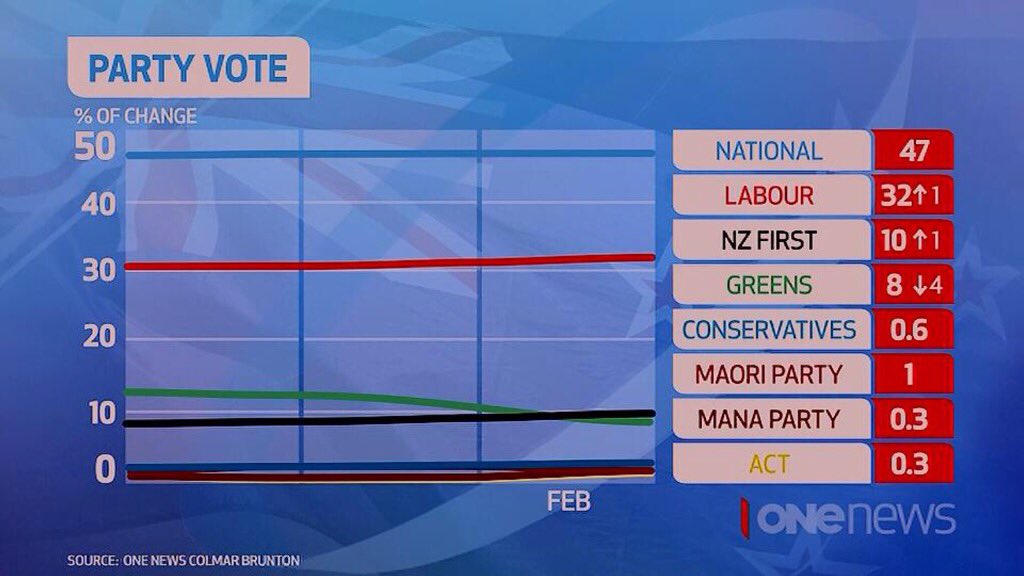
From One News, tweeted by various people:

CbtrS2MUEAALlrk

The y-axis label is wrong: this has nothing to do with change, it’s percent support.

The x-axis label is maximally unhelpful: we can guess that the most recent poll is in February, but what are the earlier data? You might think the vertical divisions are months, but the story says the previous poll was in October.

Also, given that the measurement error is large compared to the expected changes, using a line graph without points indicating the observations is misleading.

Overall, the graph doesn’t add to the numbers on the right, which is a bit of a waste.