US:China graph of the day
This (via @albertocairo) is from the Guardian, two years ago.
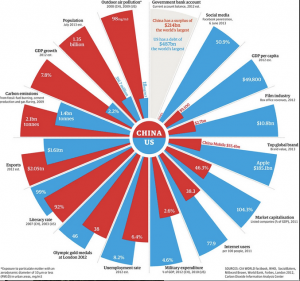
At first it looks like a pie chart, but it isn’t. It’s a set of bar charts warped into a circle, so that the ratio of blue and red areas in a wedge is the square of the ratio of the numbers. Also, the circle format means the longest wedge in each pair must be the same length: 8.6% unemployment rate is the same as 4.6% military expenditure, 104% market capitalisation, and 46 Olympic gold medals.
Many of these are proportions or per-capita figures, but not all. Carbon emissions are national totals, making China look worse. Film industry revenues and exports are totals; they are also gross revenues — because the whole visual metaphor falls apart completely for numbers that can be negative. That’s why the current-year budget surplus/deficit isn’t treated like the other numbers.
There are also some unusual definitions. “Social media”, the bar where China is furthest behind, is defined just by the proportion who use Facebook, which obviously underestimates the social-media activity of the US (and also, perhaps, of China).
The post has some discussion of the difficulties — for example, the measurement and even the definition of unemployment in the two counties — and is much better than the graph.
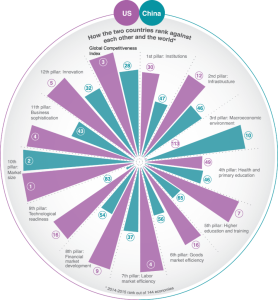
Here’s a different take on the same countries, in the same format, from the World Economic Forum
They have similar problems with total vs proportion/mean variables. They solve the y-axis problem by working with international ranks, which at least gives a common scale. However, having 1 as the largest rank and some unspecified large number as the smallest rank does make the relationship between area and number fairly weird. It also means that the actual numbers for each wedge aren’t fractions of a total in any sensible way.
If the main point is to be an eye-catching hook for the story, the Guardian graph is more successul


