Posts from August 2015 (48)

August 5, 2015

What’s in a browser language default?

Ok, so this is from Saturday and I hadn’t seen it until this morning, so perhaps it should just be left in obscurity, but:

Claims foreign buyers are increasingly snapping up Auckland houses have been further debunked, with data indicating only a fraction of visitors to a popular real estate website are Asian.

Figures released by website realestate.co.nz reveal about five per cent of all online traffic viewing Auckland property between January and April were primary speakers of an East Asian language.

Of that five per cent, only 2.8 per cent originated from outside New Zealand meaning almost half were viewing from within the country.

The problem with Labour’s analysis was that it conflated “Chinese ethnicity” and “foreign”, but at least everyone on the list had actually bought a house in Auckland, and they captured about half the purchases over a defined time period. It couldn’t say much about “foreign”, but it was at least fairly reliable on “Chinese ethnicity” and “real-estate buyer”.

This new “debunking” uses data from a real-estate website. There is no information given either about what fraction of house buyers in Auckland used the website, or about what fraction of people who used the website ended up buying a house rather than just browsing, (or about how many people have their browser’s language preferences set up correctly, since that’s what was actually measured).  Even if realestate.co.nz captured the majority of NZ real-estate buyers, it would hardly be surprising if overseas investors who primarily prefer to use non-English websites used something different.  What’s worse, if you read carefully, is they say “online traffic”: these aren’t even counts of actual people.

So far, the follow-up data sets have been even worse than Labour’s original effort. Learning more would require knowing actual residence for actual buyers of actual Auckland houses: either a large fraction over some time period or a representative sample.  Otherwise, if you have a dataset lying around that could be analysed to say something vaguely connected to the number of overseas Chinese real-estate buyers in Auckland, you might consider keeping it to yourself.
August 3, 2015

There’s nothing like a good joke

We (already!) have a Stat of the Week nomination, for the Herald’s

Conservative estimates are that the average man will lose 12,547 umbrellas during his lifetime.

At first sight this looks like deadpan humour rather than a statistic, but in that case you’d expect a by-line on the piece.  The Google, which knows all and tells all, finds thirty other examples of the statistic.  It looks as though the primary source is the Telegraph

Conservative and not at all plucked-out-of-thin-air estimates suggest that the average man will lose 12,547 umbrellas during his lifetime.

which does have a by-line, and is also attributed as the source by Monster.co.uk.  And is marginally more amusing.


Stat of the Week Competition: August 1 – 7 2015

Each week, we would like to invite readers of Stats Chat to submit nominations for our Stat of the Week competition and be in with the chance to win an iTunes voucher.

Here’s how it works:

  • Anyone may add a comment on this post to nominate their Stat of the Week candidate before midday Friday August 7 2015.
  • Statistics can be bad, exemplary or fascinating.
  • The statistic must be in the NZ media during the period of August 1 – 7 2015 inclusive.
  • Quote the statistic, when and where it was published and tell us why it should be our Stat of the Week.

Next Monday at midday we’ll announce the winner of this week’s Stat of the Week competition, and start a new one.

(more…)

Stat of the Week Competition Discussion: August 1 – 7 2015

If you’d like to comment on or debate any of this week’s Stat of the Week nominations, please do so below!

August 2, 2015

Some retail arithmetic

From a Retail New Zealand Media Fact Kit

The amount New Zealanders spend on goods from foreign websites is approaching $1.5 billion and this number is growing all the time.

GST is 15%, so the total GST payable on an amount approaching $1.5 billion would be approaching $225 million.

Since $1.5 billion would be approaching $900 per household (1.68 million households according to StatsNZ), I assume it includes quite a few business purchases as well. For these, any increase in GST on the purchase would later be deducted from the business’s GST liability, leaving a net zero.

For non-business purchases, some of that GST is already payable under current law (if the total value of a single package is over $400). Some would still not be payable if the threshold was lowered to $25.  Also, some might not be payable and definitely would not be easily collectable at the border because the purchase is an electronic download — e-books or music, for example.

Putting all these together, the potential increase in revenue has to be less than 15% of $1.5 billion, though it’s hard to say how much less.

The Media Fact Kit says

The Government misses out on at least $200 million in tax (maybe as much as $500 million) every year

Based on their expenditure numbers, that doesn’t look plausible. Still, maybe their numbers are wrong and it really is more than $200 million, and maybe even as much as $500 million.  GST would still cost something to collect, and more than it does (per dollar) within New Zealand, so the net gain to the Government would be noticeably smaller than this. They don’t even pretend to take the costs into account, they just talk about how many hip replacements could be funded with all the free money.

One of the differences between a Treasury Regulatory Impact Statement and a “Fact Kit” from a lobby group is that the numbers in the RIS have to add up and the document needs to give sources. If, as Radio New Zealand reports, there will be a proposal for Cabinet this month, we might be able to get some real numbers about the likely revenue and costs, and perhaps even how the economic impact would compare to other ways of raising taxes.

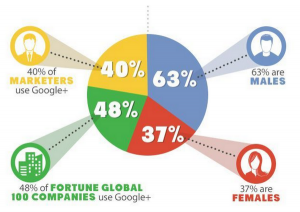
Pie chart of the week

A year-old pie chart describing Google+ users. On the right are two slices that would make up a valid but pointless pie chart: their denominator is Google+ users. On the left, two slices that have completely different denominators: all marketers and all Fortune Global 100 companies.

On top of that, it’s unlikely that the yellow slice is correct, since it’s not clear what the relevant denominator even is. And, of course, though most of the marketers probably identify as male or female, it’s not clear how the Fortune Global 100 Companies would report their gender.

CLW5t4PWUAAvPNp

From @NoahSlater, via @LewSOS, originally from kwikturnmedia about 18 months ago.

August 1, 2015

Ebola vaccine trial

You’ve probably heard that there are positive results from an Ebola vaccine trial (3News, Radio NZ, Stuff, Herald). The stories are all actually good. Here’s the (open-access) research paper

The vaccine was genetically engineered: it’s a live virus for an animal disease that doesn’t spread in humans, modified to produce just one Ebola protein. Having a live virus makes the immune system respond more enthusiastically, but you wouldn’t want to risk a vaccine containing anything even remotely like live Ebola virus. Genetic engineering produces a live virus that contains none of the functional bits of Ebola, so that even if it (improbably ) turned out to be able to spread, it wouldn’t be a big deal.

The basic trial design was to find Ebola cases and vaccinate their contacts and the contacts of their contacts, with randomisation between immediate vaccination and vaccination 21 days later.  The design was a good compromise: the public-health authorities need to know if the vaccine works in order to decide whether it can be used to control future epidemics, but since it probably does little harm, most people would want to be vaccinated.  With this design, everyone the doctors talk to will get the vaccine, either immediately or in three weeks. The design is also cost-effective, since everyone you need to vaccinate is someone the public health system would want to check up on anyway.

In practice, not everyone eligible will be end up being vaccinated: some will refuse, and some will not be contactable. You have to decide how to include the unvaccinated people in the analysis.  In this trial, no-one in the immediate-vaccination group who actually got vaccinated ended up with Ebola, which is what gives the headline 100% success rate. If you compare people who were randomised to immediate vaccination, whether they got it or not, with those who were randomised to delayed vaccination (a more common analysis strategy), the vaccine was still estimated as 75% effective.

There’s still some work to do: when the vaccine is used, it will be important to keep track as far as possible of how well it works. That’s important because we need to know if it’s worth working on a new vaccine, or whether to divert resources to research on treatments for those who are infected, or to other diseases.  For a change, though, this is good news.


NZ electoral demographics

Two more visualisations:

Kieran Healy has graphs of the male:female ratio by age for each electorate. Here are the four with the highest female proportion,  rather dramatically starting in the late teen years.

healy-electorates


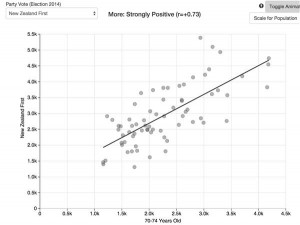
Andrew Chen has a lovely interactive scatterplot of vote for each party against demographic characteristics. For example (via Harkanwal Singh),  number of votes for NZ First vs median age

CLSSKS8UMAETS7_