Posts from August 2015 (48)

August 12, 2015

Currie Cup Predictions for Round 2

Team Ratings for Round 2

The basic method is described on my Department home page. I have made some changes to the methodology this year, including shrinking the ratings between seasons.

Here are the team ratings prior to this week’s games, along with the ratings at the start of the season.

Current Rating Rating at Season Start Difference
Western Province 5.31 4.93 0.40
Lions 3.65 3.04 0.60
Sharks 3.04 3.43 -0.40
Blue Bulls 0.96 0.17 0.80
Cheetahs -2.54 -1.75 -0.80
Pumas -6.08 -6.47 0.40
Griquas -8.18 -7.81 -0.40
Kings -10.05 -9.44 -0.60


Performance So Far

So far there have been 4 matches played, 2 of which were correctly predicted, a success rate of 50%.

Here are the predictions for last week’s games.

Game Date Score Prediction Correct
1 Griquas vs. Western Province Aug 07 19 – 43 -9.20 TRUE
2 Pumas vs. Sharks Aug 07 33 – 24 -6.40 FALSE
3 Kings vs. Lions Aug 08 14 – 51 -9.00 TRUE
4 Cheetahs vs. Blue Bulls Aug 08 19 – 57 1.60 FALSE


Predictions for Round 2

Here are the predictions for Round 2. The prediction is my estimated expected points difference with a positive margin being a win to the home team, and a negative margin a win to the away team.

Game Date Winner Prediction
1 Lions vs. Pumas Aug 14 Lions 13.20
2 Blue Bulls vs. Griquas Aug 14 Blue Bulls 12.60
3 Western Province vs. Cheetahs Aug 15 Western Province 11.30
4 Sharks vs. Kings Aug 15 Sharks 16.60


NRL Predictions for Round 23

Team Ratings for Round 23

The basic method is described on my Department home page.

Here are the team ratings prior to this week’s games, along with the ratings at the start of the season.

Current Rating Rating at Season Start Difference
Roosters 10.79 9.09 1.70
Cowboys 6.60 9.52 -2.90
Broncos 6.14 4.03 2.10
Rabbitohs 4.40 13.06 -8.70
Sea Eagles 4.25 2.68 1.60
Storm 3.62 4.36 -0.70
Bulldogs 2.08 0.21 1.90
Dragons 1.86 -1.74 3.60
Sharks 0.01 -10.76 10.80
Raiders -1.62 -7.09 5.50
Warriors -3.56 3.07 -6.60
Panthers -3.58 3.69 -7.30
Wests Tigers -6.05 -13.13 7.10
Eels -6.13 -7.19 1.10
Knights -7.45 -0.28 -7.20
Titans -10.02 -8.20 -1.80


Performance So Far

So far there have been 160 matches played, 91 of which were correctly predicted, a success rate of 56.9%.

Here are the predictions for last week’s games.

Game Date Score Prediction Correct
1 Broncos vs. Bulldogs Aug 07 16 – 18 8.60 FALSE
2 Sea Eagles vs. Rabbitohs Aug 07 28 – 8 0.10 TRUE
3 Warriors vs. Dragons Aug 08 0 – 36 3.90 FALSE
4 Sharks vs. Cowboys Aug 08 30 – 18 -6.10 FALSE
5 Eels vs. Panthers Aug 08 10 – 4 -0.50 FALSE
6 Storm vs. Titans Aug 09 36 – 14 15.70 TRUE
7 Knights vs. Roosters Aug 09 22 – 38 -15.10 TRUE
8 Raiders vs. Wests Tigers Aug 10 18 – 20 9.00 FALSE


Predictions for Round 23

Here are the predictions for Round 23. The prediction is my estimated expected points difference with a positive margin being a win to the home team, and a negative margin a win to the away team.

Game Date Winner Prediction
1 Cowboys vs. Rabbitohs Aug 13 Cowboys 5.20
2 Broncos vs. Dragons Aug 14 Broncos 7.30
3 Wests Tigers vs. Knights Aug 15 Wests Tigers 4.40
4 Panthers vs. Warriors Aug 15 Panthers 4.00
5 Roosters vs. Eels Aug 15 Roosters 19.90
6 Raiders vs. Sea Eagles Aug 16 Sea Eagles -2.90
7 Bulldogs vs. Titans Aug 16 Bulldogs 15.10
8 Sharks vs. Storm Aug 17 Storm -0.60


August 10, 2015

Stat of the Week Competition: August 8 – 14 2015

Each week, we would like to invite readers of Stats Chat to submit nominations for our Stat of the Week competition and be in with the chance to win an iTunes voucher.

Here’s how it works:

  • Anyone may add a comment on this post to nominate their Stat of the Week candidate before midday Friday August 14 2015.
  • Statistics can be bad, exemplary or fascinating.
  • The statistic must be in the NZ media during the period of August 8 – 14 2015 inclusive.
  • Quote the statistic, when and where it was published and tell us why it should be our Stat of the Week.

Next Monday at midday we’ll announce the winner of this week’s Stat of the Week competition, and start a new one.

(more…)

Stat of the Week Competition Discussion: August 8 – 14 2015

If you’d like to comment on or debate any of this week’s Stat of the Week nominations, please do so below!

August 8, 2015

Sampling error and measurement error

There’s this guy in the US called Donald Trump. You might have heard of him. He currently has a huge lead in the opinion polls over the other candidates for the Republican nomination.

Trump’s lead isn’t sampling error. He has an eleven percentage point lead in the poll averages, with sampling error well under one percentage point. That’s better than the National Party has ever managed. It’s better than the Higgs Boson has ever managed.

Even so, no serious commentator thinks Trump will be the Republican candidate. It’s not out of the question that he’d run as an independent — that’s a question of individual psychology, and much harder to answer — but he isn’t going to win the Republican primaries.

At the moment, Trump is doing well because people know who he is and because they aren’t actually making decisions. The question is something like:

If the Republican primary for President were being held today, and the candidates were Jeb Bush, Ben Carson, Chris Christie, Ted Cruz, Carly Fiorina, Jim Gilmore, Lindsey Graham, Mike Huckabee, Bobby Jindal, John Kasich, George Pataki, Rand Paul, Rick Perry, Marco Rubio, Rick Santorum, Donald Trump, and Scott Walker, for whom would you vote?

or

I know the 2016 election is far away, but who would you support for the Republican nomination for president if the candidates were…


We know from history that the answer to this sort of question at this time in the campaign doesn’t correspond to anything about the election.

There’s a temptation to believe that something you can measure very precisely must exist. There are always two other explanations to consider: your measurement process might always give precise results regardless of any reality, or you might be measuring something real but different from what you’re trying to measure.

August 6, 2015

Feel the burn

Q: What did you have for lunch?

A: Sichuan-style dry-fried green beans

Q: Because of the health benefits of spicy food?

A: Uh.. no?

Q: “Those who eat spicy foods every day have a 14 per cent lower risk of death than those who eat it less than once a week.” Didn’t you see the story?

A: I think I skipped over it.

Q: So, if my foods is spicy I have a one in seven chance of immortality?

A: No

Q: But 14% lower something? Premature death, like the Herald story says?

A: The open-access research paper says a 14% lower rate of death.

Q: Is that just as good?

A: According to David Spiegelhalter’s approximate conversion formula, that would mean about 1.5 years extra life on average, if it kept being true for your whole life.

Q: Ok. That’s still pretty good, isn’t it?

A: If it’s real.

Q: They had half a million people. It must be pretty reliable, surely?

A: The problem isn’t uncertainty so much as bias: people who eat spicy food might be slightly different in other ways.Having more people doesn’t help much with bias. Maybe there are differences in weight, or physical activity.

Q: Are there? Didn’t they look?

A: Um. Hold on. <reads> Yes, they looked, and no there aren’t. But there could be differences in lots of other things. They didn’t analyse diet in that much detail, and it wouldn’t be hard to get a bias of 14%.

Q: Is there a reason spicy food might really reduce the rate of death?

A: The Herald story says that capsaicin fights obesity, and the Stuff story says bland food makes you overeat

Q: Didn’t you just say that there weren’t weight differences?

A: Yes.

Q: But it could work some other way?

A: It could. Who can tell?

Q: Ok, apart from your correlation and causation hangups, is there any reason I shouldn’t at least use this to feel good about chilis?

A: Well, there’s the fact that the correlation went away in people who regularly drank any alcohol.

Q: Oh. Really?

A: Really. Figure 2 in the paper.

Q: But that’s just correlation, not causation, isn’t it?

A: Now you’re getting the idea.


Graph legends: ordering and context

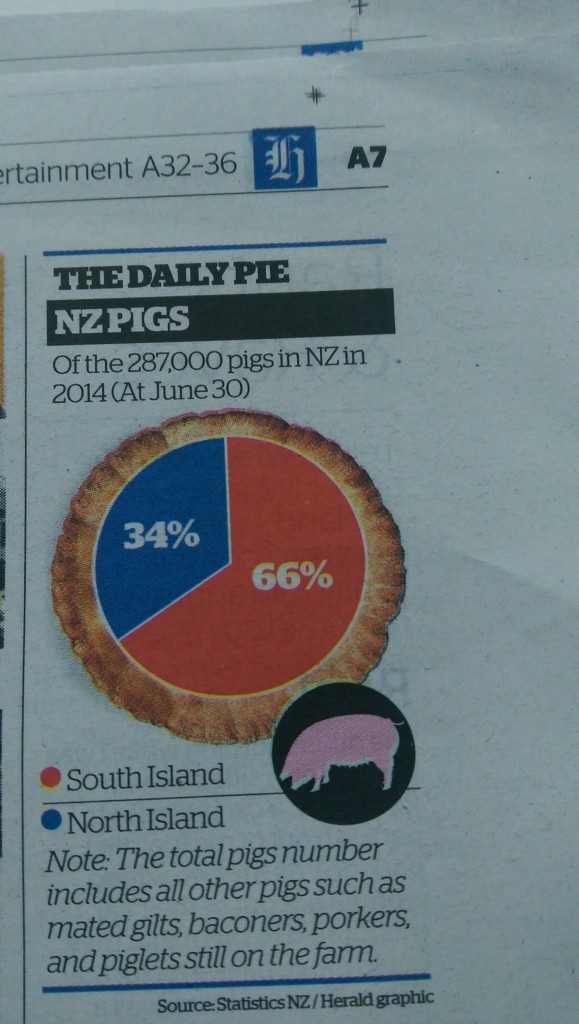
I’m not going to make a regular habit of criticising the Herald’s Daily Pie — for a start, it only appears in the print version, which I don’t see.  Today’s one, though, illustrates a couple of issues in graph legends

IMAG0098

The first issue is ordering. That’s almost trivial with just two values, but I actually found it distracting to have “South Island” at the top of the legend, especially when the corresponding red wedge is higher on the page than the blue wedge. I had to look twice to work out which wedge was which.  Reordering with “North Island” at the top would have helped, as would putting the labels on the pie (instead of the numbers).

Second, there’s the Note:

The total pigs number includes all other pigs such as mated gilts, baconers, porkers, and piglets still on the farm.

which comes directly from the StatsNZ table (of data from the Agricultural Production Survey). I know that, because these tables are the only place Google can find even the sub-phrase “such as mated gilts”.  In the context of the table, the note says that the “at June 30” columns for total pigs include the “Breeding sows (1-year-old and over)” given in earlier columns of the table, plus other categories that someone interested in the data would probably be familiar with. Without the earlier columns, the reaction should be “other than what?”.

Looking at the StatsNZ table you also learn the reason why “At June 30” in the title is important. The total “includes piglets still on the farm”, but not the much larger number of ex-piglets that have become part of the pork products industry: there were over 600,000 piglets weaned on NZ farms during the year, but only 287,000 pigs still on farms as of June 30.

August 5, 2015

Currie Cup Predictions for Round 1

Team Ratings for Round 1

The basic method is described on my Department home page. I have made some changes to the methodology this year, including shrinking the ratings between seasons.

Here are the team ratings prior to this week’s games, along with the ratings at the start of the season.

Current Rating Rating at Season Start Difference
Western Province 4.93 4.93 -0.00
Sharks 3.43 3.43 0.00
Lions 3.04 3.04 -0.00
Blue Bulls 0.17 0.17 0.00
Cheetahs -1.75 -1.75 -0.00
Pumas -6.47 -6.47 0.00
Griquas -7.81 -7.81 -0.00
Kings -9.44 -9.44 0.00


Predictions for Round 1

Here are the predictions for Round 1. The prediction is my estimated expected points difference with a positive margin being a win to the home team, and a negative margin a win to the away team.

Game Date Winner Prediction
1 Griquas vs. Western Province Aug 07 Western Province -9.20
2 Pumas vs. Sharks Aug 07 Sharks -6.40
3 Kings vs. Lions Aug 08 Lions -9.00
4 Cheetahs vs. Blue Bulls Aug 08 Cheetahs 1.60


What does 90% accuracy mean?

There was a lot of coverage yesterday about a potential new test for pancreatic cancer. 3News covered it, as did One News (but I don’t have a link). There’s a detailed report in the Guardian, which starts out:

A simple urine test that could help detect early-stage pancreatic cancer, potentially saving hundreds of lives, has been developed by scientists.

Researchers say they have identified three proteins which give an early warning of the disease, with more than 90% accuracy.

This is progress; pancreatic cancer is one of the diseases where there genuinely is a good prospect that early detection could improve treatment. The 90% accuracy, though, doesn’t mean what you probably think it means.

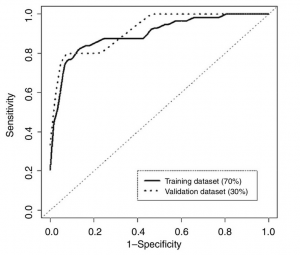
Here’s a graph showing how the error rate of the test changes with the numerical threshold used for diagnosis (figure 4, panel B, from the research paper)

pancreatic

As you move from left to right the threshold decreases; the test is more sensitive (picks up more of the true cases), but less specific (diagnoses more people who really don’t have cancer). The area under this curve is a simple summary of test accuracy, and that’s where the 90% number came from.  At what the researchers decided was the optimal threshold, the test correctly reported 82% of early-stage pancreatic cancers, but falsely reported a positive result in 11% of healthy subjects.  These figures are from the set of people whose data was used in putting the test together; in a new set of people (“validation dataset”) the error rate was very slightly worse.

The research was done with an approximately equal number of healthy people and people with early-stage pancreatic cancer. They did it that way because that gives the most information about the test for given number of people.  It’s reasonable to hope that the area under the curve, and the sensitivity and specificity of the test will be the same in the general population. Even so, the accuracy (in the non-technical meaning of the word) won’t be.

When you give this test to people in the general population, nearly all of them will not have pancreatic cancer. I don’t have NZ data, but in the UK the current annual rate of new cases goes from 4 people out of 100,000 at age 40 to 100 out of 100,000 people 85+.   The average over all ages is 13 cases per 100,000 people per year.

If 100,000 people are given the test and 13 have early-stage pancreatic cancer, about 10 or 11 of the 13 cases will have positive tests, but so will 11,000 healthy people.  Of those who test positive, 99.9% will not have pancreatic cancer.  This might still be useful, but it’s not what most people would think of as 90% accuracy.


NRL Predictions for Round 22

Team Ratings for Round 22

The basic method is described on my Department home page.

Here are the team ratings prior to this week’s games, along with the ratings at the start of the season.

Current Rating Rating at Season Start Difference
Roosters 10.71 9.09 1.60
Cowboys 7.85 9.52 -1.70
Broncos 6.90 4.03 2.90
Rabbitohs 5.77 13.06 -7.30
Storm 3.16 4.36 -1.20
Sea Eagles 2.88 2.68 0.20
Bulldogs 1.33 0.21 1.10
Dragons -0.79 -1.74 0.90
Raiders -0.84 -7.09 6.20
Warriors -0.91 3.07 -4.00
Sharks -1.24 -10.76 9.50
Panthers -3.11 3.69 -6.80
Eels -6.60 -7.19 0.60
Wests Tigers -6.83 -13.13 6.30
Knights -7.38 -0.28 -7.10
Titans -9.57 -8.20 -1.40


Performance So Far

So far there have been 152 matches played, 88 of which were correctly predicted, a success rate of 57.9%.

Here are the predictions for last week’s games.

Game Date Score Prediction Correct
1 Roosters vs. Bulldogs Jul 31 38 – 28 12.80 TRUE
2 Wests Tigers vs. Storm Jul 31 34 – 16 -10.90 FALSE
3 Warriors vs. Sharks Aug 01 14 – 18 5.70 FALSE
4 Cowboys vs. Raiders Aug 01 32 – 24 12.30 TRUE
5 Sea Eagles vs. Broncos Aug 01 44 – 14 -5.80 FALSE
6 Dragons vs. Knights Aug 02 46 – 24 7.60 TRUE
7 Rabbitohs vs. Panthers Aug 02 20 – 16 13.20 TRUE
8 Titans vs. Eels Aug 03 24 – 14 -1.60 FALSE


Predictions for Round 22

Here are the predictions for Round 22. The prediction is my estimated expected points difference with a positive margin being a win to the home team, and a negative margin a win to the away team.

Game Date Winner Prediction
1 Broncos vs. Bulldogs Aug 07 Broncos 8.60
2 Sea Eagles vs. Rabbitohs Aug 07 Sea Eagles 0.10
3 Warriors vs. Dragons Aug 08 Warriors 3.90
4 Sharks vs. Cowboys Aug 08 Cowboys -6.10
5 Eels vs. Panthers Aug 08 Panthers -0.50
6 Storm vs. Titans Aug 09 Storm 15.70
7 Knights vs. Roosters Aug 09 Roosters -15.10
8 Raiders vs. Wests Tigers Aug 10 Raiders 9.00