Posts from August 2015 (48)

August 31, 2015

Gender gap

As I’ve noted in the past, one of the big components of the remaining gender pay gap is lower pay for jobs that attract more women. I thought this was an issue where direct action would be infeasible. Maybe not.

Two New Zealand groups are now trying to target this, as described by Kirsty Johnson and Nicholas Jones in the Herald. When trying legal action, midwives and education support workers have the advantage that their wages are set by the government.

Having set wages for a large group gives the case someone to target, and it also weakens the counterargument based on individual differences. I don’t know whether this sort of claim is likely to succeed under NZ law, or what the impact would be if it did. I don’t even known whether success is desirable. But it’s an interesting approach to a real problem.

Graph of the day

Literally, this time. I got this from Andrew Gelman, but it’s too good not to share. It’s originally from the Wall Street Journal

image001

Apart from the attempts to make the body part representative of the activity, the unwisdom of playing soccer in high heels, and the mystery of what it actually is that she’s eating or drinking (a martini? an icecream?), there are some generalisable graphical points.

First, comparison of area between different shapes is hard, and so isn’t a good way to display data: it’s not immediately clear whether the Knee of Religion is larger than the Forehead of Education or the Shoe of Caring.

Second, trying to code the direction of change with colour means you can’t use colour (consistently) to distinguish categories.

Third, some of the figures aren’t very helpful because they average over everyone: only about 60% of the adult population is in paid employment, and only a small proportion are in education. For people who work or study the time spent is a lot more than the average, for everyone else it’s zero.

And finally, if you have to write all the numbers on the graph, the graph isn’t doing its job.

Stat of the Week Competition: August 29 – September 4 2015

Each week, we would like to invite readers of Stats Chat to submit nominations for our Stat of the Week competition and be in with the chance to win an iTunes voucher.

Here’s how it works:

  • Anyone may add a comment on this post to nominate their Stat of the Week candidate before midday Friday September 4 2015.
  • Statistics can be bad, exemplary or fascinating.
  • The statistic must be in the NZ media during the period of August 29 – September 4 2015 inclusive.
  • Quote the statistic, when and where it was published and tell us why it should be our Stat of the Week.

Next Monday at midday we’ll announce the winner of this week’s Stat of the Week competition, and start a new one.

(more…)

Stat of the Week Competition Discussion: August 29 – September 4 2015

If you’d like to comment on or debate any of this week’s Stat of the Week nominations, please do so below!

August 30, 2015

Briefly

  • “If you get the software a little bit wrong, you will break the law thousands of times” A different sort of big data story from Matt Levine
  • The number of ‘moderate’ voters is seriously overestimated, from Vox
  • You can do randomised controlled trials of natural products, as in the trial of kānuka honey for acne, covered by Jamie Morton at the Herald.  The trial doesn’t show the product is better than ordinary honey or that it’s better than other acne treatments, but it does show it’s better than just soap and water.

Genetically targeted cancer treatment

Targeting cancer treatments to specific genetic variants has certainly had successes with common mutations — the most well known example must be Herceptin for an important subset of  breast cancer.  Reasonably affordable genetic sequencing has the potential for finding specific, uncommon mutations in cancers where there isn’t a standard, approved drug.

Most good ideas in medicine don’t work, of course, so it’s important to see if this genetic sequencing really helps, and how much it costs.  Ideally this would be in a randomised trial where patients are randomised to the best standard treatment or to genetically-targeted treatment. What we have so far is a comparison of disease progress for genetically-targeted treatment compared to a matched set of patients from the same clinic in previous years.  Here’s a press release, and two abstracts from a scientific conference.

In 72 out of 243 patients whose disease had progressed despite standard treatment, the researchers found a mutation that suggested the patient would benefit from some drug they wouldn’t normally have got. The median time until these patients starting getting worse again was 23 weeks; in the historical patients it was 12 weeks.

The Boston Globe has an interesting story talking to researchers and a patient (though it gets some of the details wrong).  The patient they interview had melanoma and got a drug approved for melanoma patients but only those with one specific mutation (since that’s where the drug was tested). Presumably, though the story doesn’t say, he had a different mutation in the same gene — that’s where the largest benefit of sequencing is likely to be.

An increase from 12 to 23 weeks isn’t terribly impressive, and it came at a cost of US$32000 — the abstract and press release say there wasn’t a cost increase, but that’s because they looked at cost per week, not total cost.  It’s not nothing, though; it’s probably large enough that a clinical trial makes sense and small enough that a trial is still ethical and feasible.

The Boston Globe story is one of the first products of their new health-and-medicine initiative, called “Stat“. That’s not short for “statistics;” it’s the medical slang meaning “right now”, from the Latin statum.

August 28, 2015

Trying again

CNbxnQDWgAAXlKL

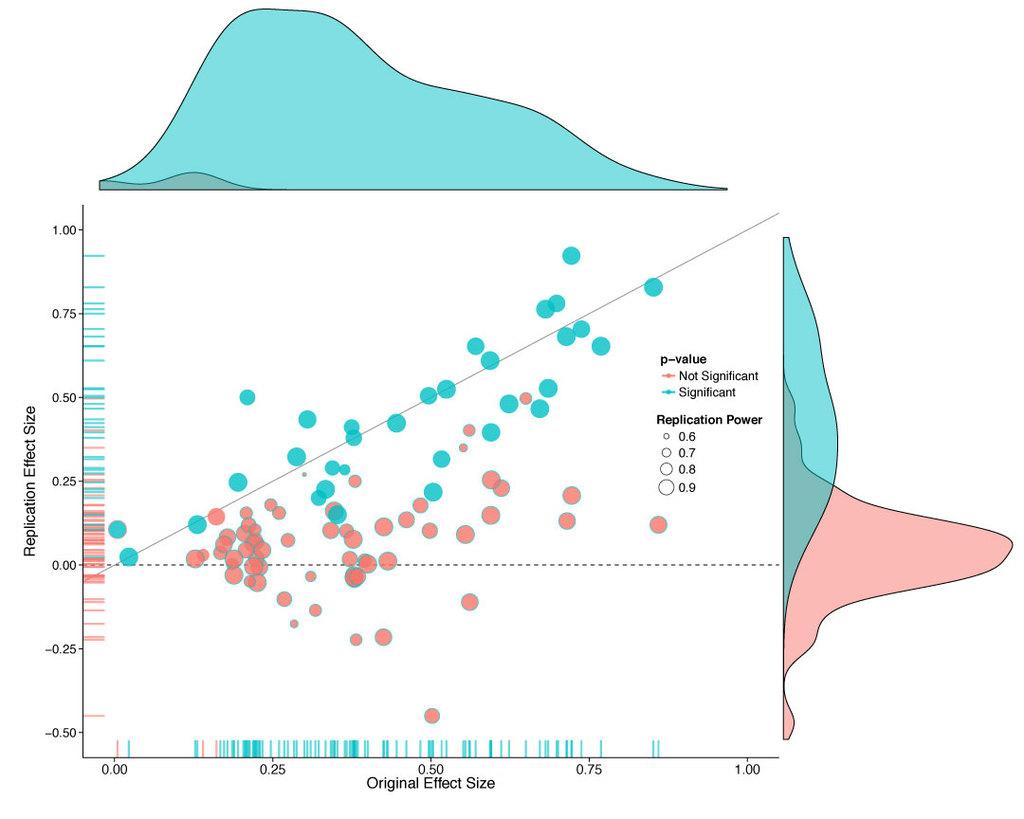
This graph is from the Open Science Framework attempt to replicate 100 interesting results in experimental psychology, led by Brian Nozek and published in Science today.

About a third of the experiments got statistically significant results in the same direction as the originals.  Averaging all the experiments together,  the effect size was only half that seen originally, but the graph suggests another way to look at it.  It seems that about half the replications got basically the same result as the original, up to random variation, and about half the replications found nothing.

Ed Yong has a very good article about the project in The Atlantic. He says it’s worse than psychologists expected (but at least now they know).  It’s actually better than I would have expected — I would have guessed that the replicated effects would average quite a bit smaller than the originals.

The same thing is going to be true for a lot of small-scale experiments in other fields.

August 26, 2015

The death of the novel?

So, the Guardian has a list of the top-100 best ever novels written in English.  There’s the usual problem that lit people have with genre (can it really be true that The Moonstone is the best detective novel in English?), but I’m not an expert in novels.

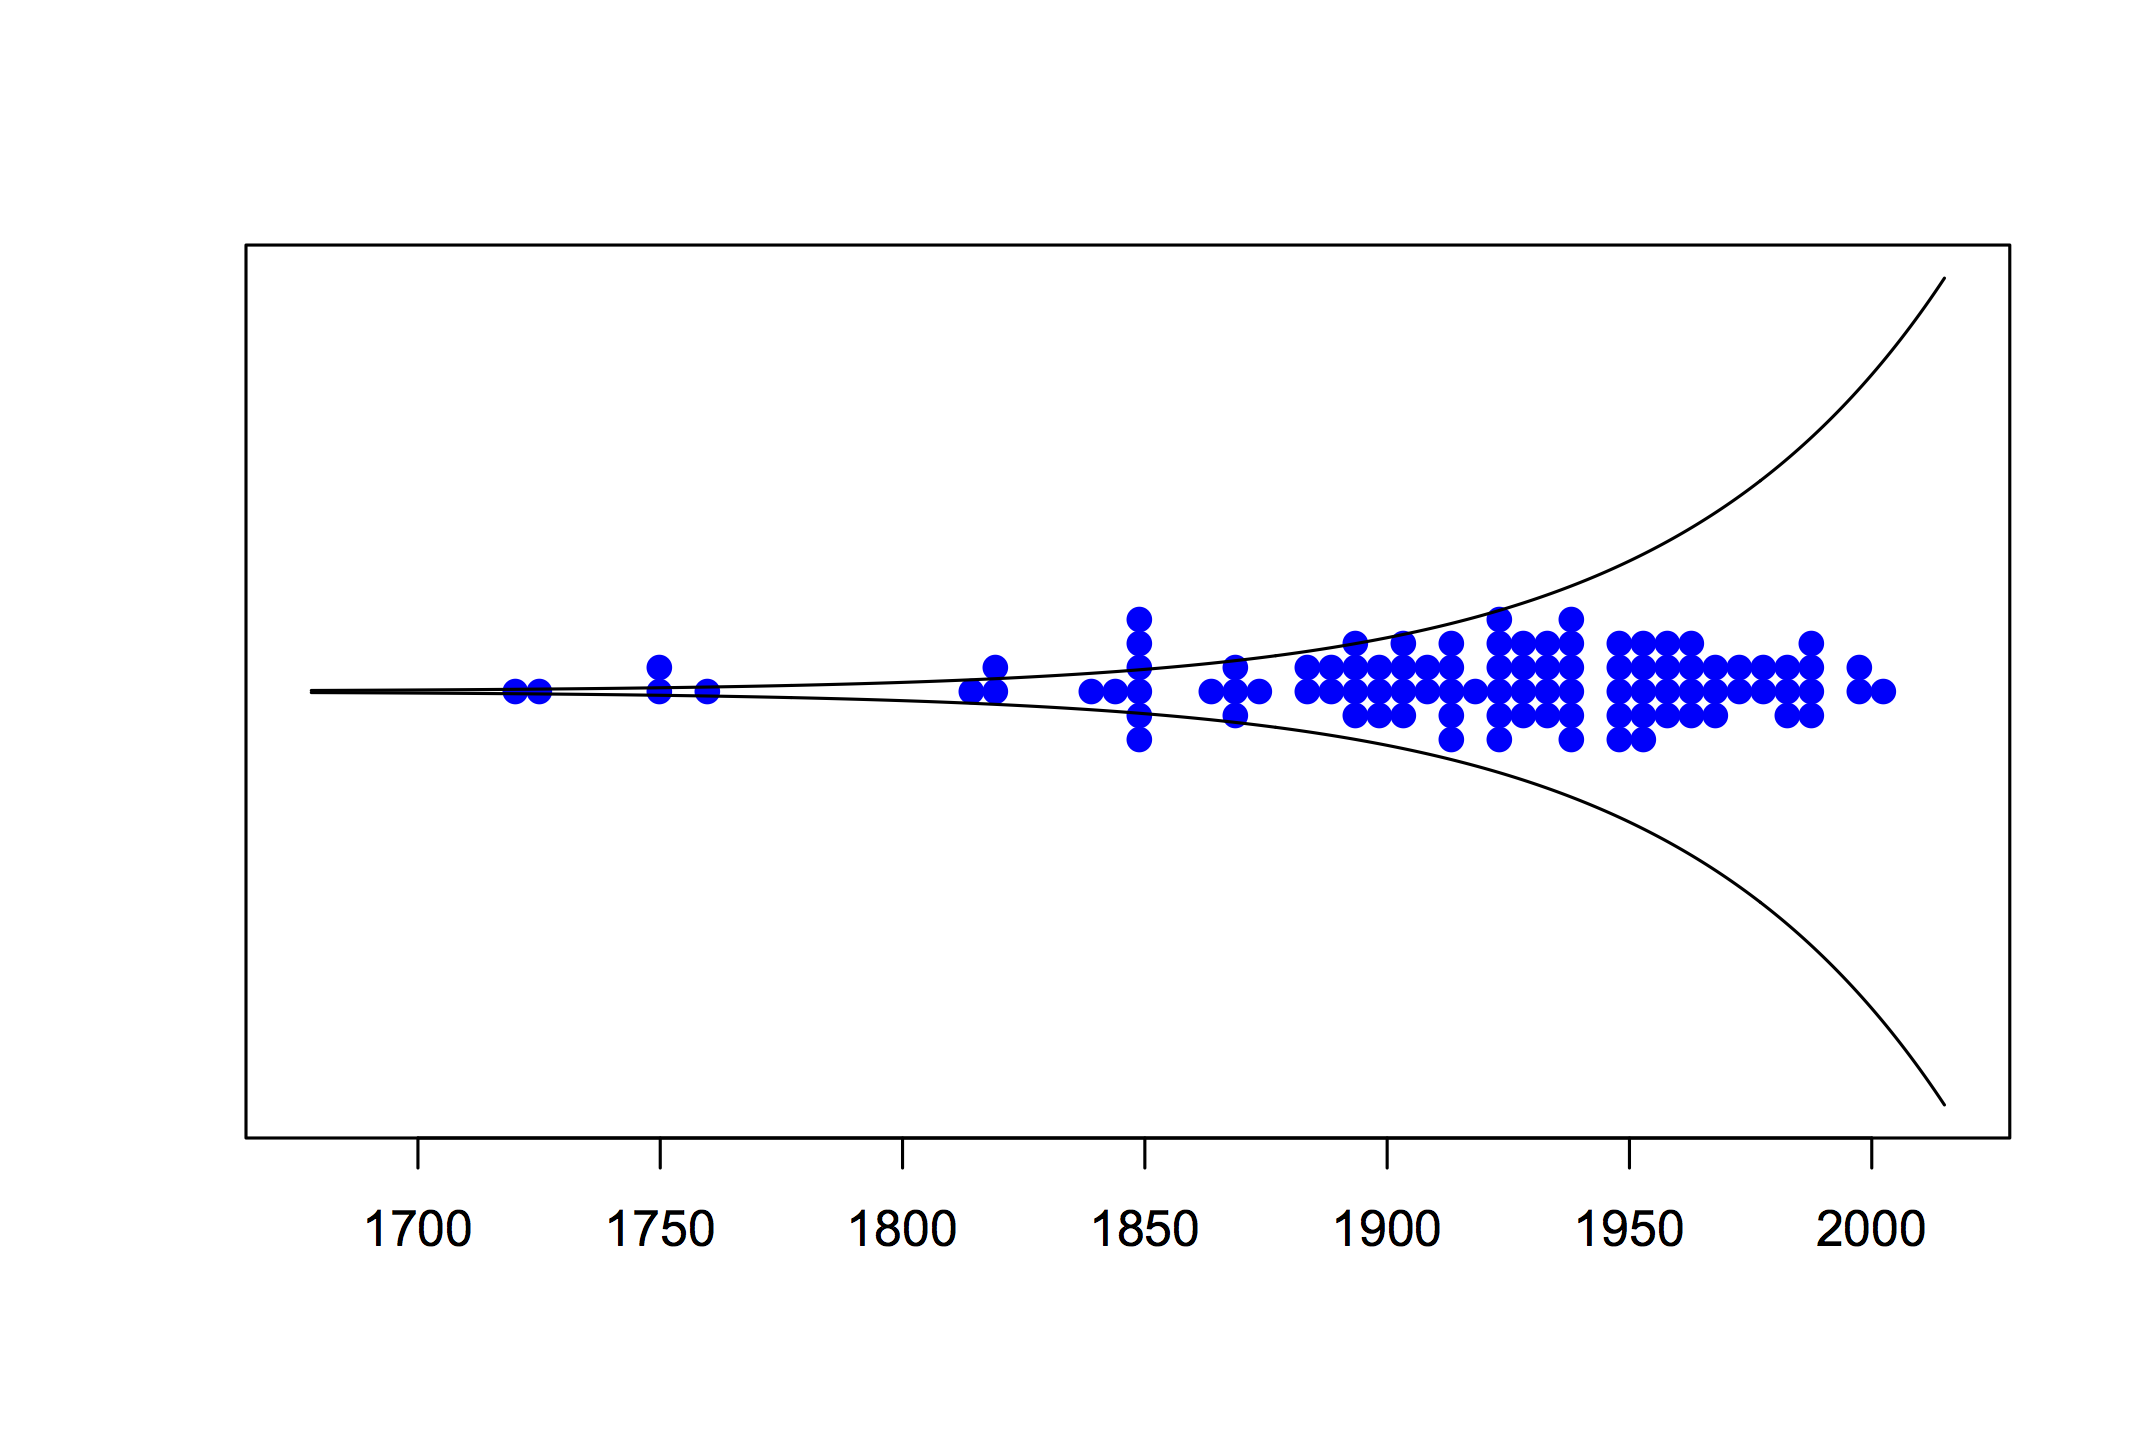
There have been complaints about the diversity of the list, and that’s where there’s a definite statistical anomaly. The books are old. For example, 33 of them come from before the start of the twentieth century and none of them from after the end of the twentieth century, even though many more novels were published in the latter period.

An article in Seed magazine, and its technical notes tried to estimate the number of new book authors each year over time. That’s not quite the same thing, since we aren’t considering only first books and are considering only novels. However, it’s a reasonable surrogate. Using their estimates, as many books were published before 1930 (55 places on the list) as after 2000 (no places on the list).  Here’s a graph, with the dots indicating books on the list and the lines indicating total published.

arthurs

As I said, this isn’t my field. Maybe nineteenth century novels really were hundreds of times more likely to be ‘great’ than modern novels. But it’s not the only possible explanation.

ITM Cup Predictions for Round 3

Team Ratings for Round 3

The basic method is described on my Department home page.

Here are the team ratings prior to this week’s games, along with the ratings at the start of the season.

Current Rating Rating at Season Start Difference
Tasman 12.32 12.86 -0.50
Canterbury 10.80 10.90 -0.10
Counties Manukau 7.05 7.86 -0.80
Taranaki 5.49 7.70 -2.20
Auckland 4.79 5.14 -0.30
Hawke’s Bay 2.72 -0.57 3.30
Wellington 0.79 -4.62 5.40
Manawatu -1.98 -1.52 -0.50
Southland -4.22 -6.01 1.80
Waikato -5.31 -6.96 1.60
Otago -6.35 -4.84 -1.50
Northland -6.76 -3.64 -3.10
Bay of Plenty -8.92 -9.77 0.80
North Harbour -14.41 -10.54 -3.90


Performance So Far

So far there have been 14 matches played, 10 of which were correctly predicted, a success rate of 71.4%.

Here are the predictions for last week’s games.

Game Date Score Prediction Correct
1 North Harbour vs. Wellington Aug 20 0 – 43 -4.20 TRUE
2 Tasman vs. Bay of Plenty Aug 21 34 – 13 26.20 TRUE
3 Manawatu vs. Waikato Aug 22 21 – 28 10.50 FALSE
4 Northland vs. Southland Aug 22 18 – 27 3.80 FALSE
5 Otago vs. Hawke’s Bay Aug 22 22 – 39 -2.40 TRUE
6 Auckland vs. Taranaki Aug 23 30 – 24 2.70 TRUE
7 Canterbury vs. Counties Manukau Aug 23 20 – 15 8.40 TRUE


Predictions for Round 3

Here are the predictions for Round 3. The prediction is my estimated expected points difference with a positive margin being a win to the home team, and a negative margin a win to the away team.

Game Date Winner Prediction
1 Bay of Plenty vs. Southland Aug 26 Southland -0.70
2 Tasman vs. Manawatu Aug 27 Tasman 18.30
3 Counties Manukau vs. Hawke’s Bay Aug 28 Counties Manukau 8.30
4 Auckland vs. Canterbury Aug 29 Canterbury -2.00
5 Taranaki vs. Otago Aug 29 Taranaki 15.80
6 Wellington vs. Northland Aug 29 Wellington 11.50
7 Bay of Plenty vs. Waikato Aug 30 Bay of Plenty 0.40
8 Southland vs. North Harbour Aug 30 Southland 14.20


Currie Cup Predictions for Round 4

Team Ratings for Round 4

The basic method is described on my Department home page.

Here are the team ratings prior to this week’s games, along with the ratings at the start of the season.

Current Rating Rating at Season Start Difference
Western Province 4.60 4.93 -0.30
Lions 4.27 3.04 1.20
Sharks 2.36 3.43 -1.10
Blue Bulls 1.71 0.17 1.50
Cheetahs -1.81 -1.75 -0.10
Pumas -6.17 -6.47 0.30
Griquas -8.95 -7.81 -1.10
Kings -9.90 -9.44 -0.50


Performance So Far

So far there have been 12 matches played, 8 of which were correctly predicted, a success rate of 66.7%.

Here are the predictions for last week’s games.

Game Date Score Prediction Correct
1 Kings vs. Pumas Aug 21 13 – 15 -0.00 TRUE
2 Griquas vs. Cheetahs Aug 21 9 – 31 -2.70 TRUE
3 Sharks vs. Lions Aug 22 16 – 31 2.40 FALSE
4 Blue Bulls vs. Western Province Aug 22 47 – 29 -0.30 FALSE


Predictions for Round 4

Here are the predictions for Round 4. The prediction is my estimated expected points difference with a positive margin being a win to the home team, and a negative margin a win to the away team.

Game Date Winner Prediction
1 Pumas vs. Lions Aug 28 Lions -6.90
2 Cheetahs vs. Western Province Aug 28 Western Province -2.90
3 Griquas vs. Blue Bulls Aug 29 Blue Bulls -7.20
4 Kings vs. Sharks Aug 29 Sharks -8.80