Posts from July 2015 (36)

July 8, 2015

Stolen car statistics

Both the Herald and Stuff are covering the AA Insurance list of most-stolen car brands. They have both made it clear what the ranking on the list actually means – -what the denominator is:

“It’s not that there are more Honda Torneos on the road than any other car,” said AA Insurance customer relations manager Amelia Macandrew. “It’s the probability of them being stolen that’s far greater than any other car we insure.” (Stuff)

and

To calculate theft incidence rates, AA Insurance measures the number of claims made for each model of car for which 20 or more claims have been made, as a percentage of the total number of policies it holds for that model. (Herald)


It wasn’t as clear in past years: credit to the reporters and to AA Insurance for the improvement.


July 6, 2015

Stat of the Week Competition: July 4 – 10 2015

Each week, we would like to invite readers of Stats Chat to submit nominations for our Stat of the Week competition and be in with the chance to win an iTunes voucher.

Here’s how it works:

  • Anyone may add a comment on this post to nominate their Stat of the Week candidate before midday Friday July 10 2015.
  • Statistics can be bad, exemplary or fascinating.
  • The statistic must be in the NZ media during the period of July 4 – 10 2015 inclusive.
  • Quote the statistic, when and where it was published and tell us why it should be our Stat of the Week.

Next Monday at midday we’ll announce the winner of this week’s Stat of the Week competition, and start a new one.

(more…)

Stat of the Week Competition Discussion: July 4 – 10 2015

If you’d like to comment on or debate any of this week’s Stat of the Week nominations, please do so below!

Briefly

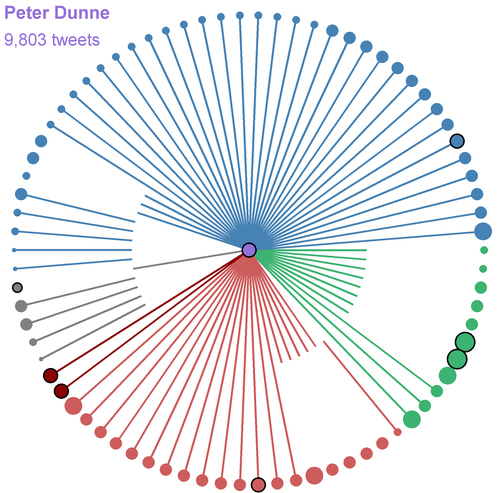
  • Visualizing the Twitter networks of NZ MPs: on the Herald data blog, a post by Chris McDowall, and additional graphics by Jayne Ihaka.  peterdunne
    Now we just need a way to tell which accounts are actually used by MPs and which ones are twitterwallahs.
  • There was a big discrepancy among bookies on the odds for the Greek referendum. Paddy Power estimates an 80% chance of ‘yes’ and has paid out winnings early. Betfair is almost certain of “No”.  The wisdom of crowds has definite limitations, especially in situations where no-one really has a clue.
  • Sense about Science have a new guide to screening tests. I’ll repeat my testing soundbite: “Screening is the opposite of treatment: you go in healthy and come out with a disease”.
  • Measuring happiness: a discussion at the New York Times and an independent (I think) skeptical post by John Quiggin arguing for measures of unhappiness.
July 1, 2015

NRL Predictions for Round 17

Team Ratings for Round 17

The basic method is described on my Department home page.

Here are the team ratings prior to this week’s games, along with the ratings at the start of the season.

Current Rating Rating at Season Start Difference
Roosters 8.23 9.09 -0.90
Broncos 7.52 4.03 3.50
Cowboys 4.67 9.52 -4.90
Rabbitohs 4.06 13.06 -9.00
Storm 2.78 4.36 -1.60
Dragons 2.04 -1.74 3.80
Warriors 1.76 3.07 -1.30
Bulldogs 0.38 0.21 0.20
Panthers -0.49 3.69 -4.20
Raiders -2.21 -7.09 4.90
Eels -2.93 -7.19 4.30
Sea Eagles -2.96 2.68 -5.60
Sharks -4.01 -10.76 6.70
Knights -4.99 -0.28 -4.70
Titans -5.78 -8.20 2.40
Wests Tigers -6.74 -13.13 6.40


Performance So Far

So far there have been 118 matches played, 67 of which were correctly predicted, a success rate of 56.8%.

Here are the predictions for last week’s games.

Game Date Score Prediction Correct
1 Broncos vs. Knights Jun 26 44 – 22 14.40 TRUE
2 Rabbitohs vs. Sea Eagles Jun 26 20 – 8 9.70 TRUE
3 Cowboys vs. Sharks Jun 27 18 – 24 14.50 FALSE
4 Eels vs. Dragons Jun 27 16 – 12 -3.00 FALSE
5 Warriors vs. Raiders Jun 27 30 – 8 5.70 TRUE
6 Roosters vs. Titans Jun 28 20 – 10 18.20 TRUE
7 Wests Tigers vs. Panthers Jun 28 12 – 35 -0.10 TRUE
8 Bulldogs vs. Storm Jun 29 20 – 4 -1.90 FALSE


Predictions for Round 17

Here are the predictions for Round 17. The prediction is my estimated expected points difference with a positive margin being a win to the home team, and a negative margin a win to the away team.

Game Date Winner Prediction
1 Panthers vs. Rabbitohs Jul 03 Rabbitohs -1.50
2 Dragons vs. Cowboys Jul 04 Dragons 0.40
3 Sea Eagles vs. Sharks Jul 05 Sea Eagles 4.10
4 Wests Tigers vs. Eels Jul 06 Eels -0.80


Super 15 Prediction for the Final

Team Ratings for the Final

The basic method is described on my Department home page.

Here are the team ratings prior to this week’s games, along with the ratings at the start of the season.

Current Rating Rating at Season Start Difference
Crusaders 10.77 10.42 0.40
Hurricanes 9.06 2.89 6.20
Highlanders 6.98 -2.54 9.50
Waratahs 6.13 10.00 -3.90
Brumbies 4.27 2.20 2.10
Chiefs 3.58 2.23 1.40
Stormers 0.47 1.68 -1.20
Bulls 0.39 2.88 -2.50
Lions -0.55 -3.39 2.80
Sharks -0.65 3.91 -4.60
Blues -4.49 1.44 -5.90
Rebels -4.89 -9.53 4.60
Force -7.16 -4.67 -2.50
Cheetahs -8.22 -5.55 -2.70
Reds -8.70 -4.98 -3.70


Performance So Far

So far there have been 124 matches played, 81 of which were correctly predicted, a success rate of 65.3%.

Here are the predictions for last week’s games.

Game Date Score Prediction Correct
1 Hurricanes vs. Brumbies Jun 27 29 – 9 7.80 TRUE
2 Waratahs vs. Highlanders Jun 27 17 – 35 6.40 FALSE


Prediction for the Final

Here is the prediction for the final. The prediction is my estimated expected points difference with a positive margin being a win to the home team, and a negative margin a win to the away team.

Game Date Winner Prediction
1 Hurricanes vs. Highlanders Jul 04 Hurricanes 6.10