Posts from June 2015 (39)

June 4, 2015

Round up on the chocolate hoax

Science journalism (or science) has a problem:

Meh. Unimpressed.

Study was unethical


June 3, 2015

NRL Predictions for Round 13

Team Ratings for Round 13

The basic method is described on my Department home page.

Here are the team ratings prior to this week’s games, along with the ratings at the start of the season.

Current Rating Rating at Season Start Difference
Roosters 10.22 9.09 1.10
Cowboys 6.53 9.52 -3.00
Broncos 5.13 4.03 1.10
Rabbitohs 4.84 13.06 -8.20
Storm 4.08 4.36 -0.30
Dragons 3.76 -1.74 5.50
Warriors 0.60 3.07 -2.50
Panthers -0.10 3.69 -3.80
Bulldogs -1.41 0.21 -1.60
Sea Eagles -1.51 2.68 -4.20
Knights -2.17 -0.28 -1.90
Raiders -3.12 -7.09 4.00
Eels -4.80 -7.19 2.40
Wests Tigers -6.65 -13.13 6.50
Titans -6.74 -8.20 1.50
Sharks -7.34 -10.76 3.40


Performance So Far

So far there have been 91 matches played, 53 of which were correctly predicted, a success rate of 58.2%.

Here are the predictions for last week’s games.

Game Date Score Prediction Correct
1 Panthers vs. Eels May 29 20 – 26 9.90 FALSE
2 Cowboys vs. Sea Eagles May 30 18 – 14 12.20 TRUE
3 Raiders vs. Broncos May 30 12 – 24 -4.10 TRUE
4 Titans vs. Rabbitohs May 30 16 – 22 -9.00 TRUE
5 Dragons vs. Sharks May 31 42 – 6 10.70 TRUE
6 Warriors vs. Knights May 31 24 – 20 7.30 TRUE
7 Roosters vs. Storm Jun 01 24 – 2 7.00 TRUE


Predictions for Round 13

Here are the predictions for Round 13. The prediction is my estimated expected points difference with a positive margin being a win to the home team, and a negative margin a win to the away team.

Game Date Winner Prediction
1 Broncos vs. Sea Eagles Jun 05 Broncos 9.60
2 Wests Tigers vs. Titans Jun 05 Wests Tigers 3.10
3 Knights vs. Raiders Jun 06 Knights 3.90
4 Panthers vs. Storm Jun 06 Storm -1.20
5 Rabbitohs vs. Warriors Jun 06 Rabbitohs 8.20
6 Sharks vs. Roosters Jun 07 Roosters -14.60
7 Bulldogs vs. Dragons Jun 08 Dragons -2.20
8 Eels vs. Cowboys Jun 08 Cowboys -8.30


Super 15 Predictions for Round 17

Team Ratings for Round 17

The basic method is described on my Department home page.

Here are the team ratings prior to this week’s games, along with the ratings at the start of the season.

Current Rating Rating at Season Start Difference
Crusaders 9.06 10.42 -1.40
Waratahs 6.16 10.00 -3.80
Hurricanes 6.07 2.89 3.20
Highlanders 5.12 -2.54 7.70
Brumbies 4.12 2.20 1.90
Chiefs 3.60 2.23 1.40
Stormers 3.59 1.68 1.90
Bulls 2.26 2.88 -0.60
Lions -1.12 -3.39 2.30
Blues -1.68 1.44 -3.10
Sharks -1.94 3.91 -5.90
Rebels -4.58 -9.53 4.90
Reds -7.37 -4.98 -2.40
Force -7.38 -4.67 -2.70
Cheetahs -8.92 -5.55 -3.40


Performance So Far

So far there have been 106 matches played, 71 of which were correctly predicted, a success rate of 67%.

Here are the predictions for last week’s games.

Game Date Score Prediction Correct
1 Crusaders vs. Hurricanes May 29 35 – 18 5.60 TRUE
2 Brumbies vs. Bulls May 29 22 – 16 6.40 TRUE
3 Sharks vs. Rebels May 29 25 – 21 7.80 TRUE
4 Highlanders vs. Chiefs May 30 36 – 9 2.80 TRUE
5 Force vs. Reds May 30 10 – 32 7.20 FALSE
6 Stormers vs. Cheetahs May 30 42 – 12 14.70 TRUE
7 Lions vs. Waratahs May 30 27 – 22 -3.90 FALSE


Predictions for Round 17

Here are the predictions for Round 17. The prediction is my estimated expected points difference with a positive margin being a win to the home team, and a negative margin a win to the away team.

Game Date Winner Prediction
1 Hurricanes vs. Highlanders Jun 05 Hurricanes 4.90
2 Force vs. Brumbies Jun 05 Brumbies -7.50
3 Rebels vs. Bulls Jun 06 Bulls -2.30
4 Blues vs. Crusaders Jun 06 Crusaders -6.70
5 Reds vs. Chiefs Jun 06 Chiefs -6.50
6 Cheetahs vs. Waratahs Jun 06 Waratahs -10.60
7 Stormers vs. Lions Jun 06 Stormers 8.70


Cancer correlation and causation

It’s a change to have a nice simple correlation vs causation problem. The Herald (from the Telegraph) says

Statins could cut the risk of dying from cancer by up to half, large-scale research suggests. A series of studies of almost 150,000 people found that those taking the cheap cholesterol-lowering drugs were far more likely to survive the disease.

Looking at the conference abstracts,  a big study found a hazard ratio of 0.78 based on about 3000 cancer deaths in women and a smaller study found a hazard ratio of 0.57 based on about half that many prostate cancer deaths (in men, obviously). That does sound impressive, but it is just a correlation. The men in the prostate cancer studies who happened to be taking statins were less likely to die of cancer; the women in the Women’s Health Initiative studies who happened to be taking statins were less likely to die of cancer.

There’s a definite irony that the results come from the Women’s Health Initiative. The WHI, one of the most expensive trials ever conducted, was set up to find out if hormone supplementation in post-menopausal women reduced the risk of serious chronic disease. Observational studies, comparing women who happened to be taking hormones with those who happened not to be, had found strong associations. In one landmark paper, women taking estrogen had almost half the rate of heart attack as those not taking estrogen, and a 22% lower rate of death from cardiovascular causes. As you probably remember, the WHI randomised trials showed no protective effect — in fact, a small increase in risk.

It’s encouraging that the WHI data show the same lack of association with getting cancer that summaries of randomised trials have shown, and that there’s enough data the association is unlikely to be a chance finding. As with estrogen and heart attack there are biochemical reasons why statins could increase survival in cancer. It could be true, but this isn’t convincing evidence.

Maybe someone should do a randomised trial.

Expensive new cancer drugs

From Stuff:

Revolutionary new drugs that could cure terminal cancer should be on the market here within a few years but patients will have to be “super rich” to afford them.

One four-dose treatment of the drug now under clinical trials costs about $140,000 while other ongoing courses can cost hundreds of thousands of dollars

That’s one real possibility, but there are others.

Firstly, the new drugs might not be all that good. After all, we had some of the same enthusiasm about angiogenesis inhibitors in the late 1990s and about selective tyrosine kinase inhibitors a few years later. The new immunotherapies look wonderful, but so far only  for a minority of patients. And we’re seeing their best side now, from trials stopped early for efficacy.

Alternatively, they might be too effective.  The adaptive immune system is kept under the same sort of strict controls as nuclear weapons, and for much the same reason — its ability to turn the battlefield into a lifeless wasteland. The most successful new treatments remove one of the safety checkpoints, and it’s possible that researchers won’t be able to dramatically expand the range of patients treated without producing dangerous collateral damage.

Finally, there’s the happy possibility. If we get evidence that inhibiting PD-1 and other T-cell checkpoints is safe and broadly effective, everyone will want to make inhibitors, and we’ll get competition. Bristol-Myers-Squib has a monopoly on nivolumab, but it doesn’t have a monopoly on immune checkpoint inhibition. This is already happening, as Bruce Booth reports from the ASCO conference

Most major oncology players have abstracts involving PD-1, including Merck, BMS, AZ, Novartis, Roche, and pretty much everyone else.  Other T-cell related targets like CTLA-4, TIM-3, OX-40, and LAG-3 round out the list of frequent mentions

The drugs still won’t be cheap, because each company will need its own clinical trials, but the development risk will be much lower and the margin for rapacious price-gouging narrower, so they won’t be $140000 per patient for very long.

June 2, 2015

Improving pie-charts

We’ve seen animations of this sort from Darkhorse Analytics before, but this one is special. It shows how to remove unnecessary components from a pie chart to produce something genuinely useful, though, sadly, the procedure doesn’t work for all pie charts.

Click on the picture to start the animation

devourThePie3

(via @JennyBryan)

June 1, 2015

Graph of the week

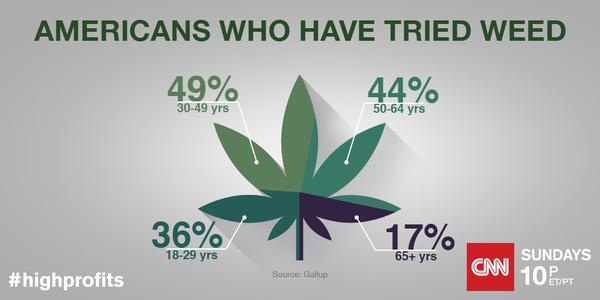
Yes, it’s only Monday, but this one will be hard to beat (from CNN on Twitter, via @albertocairo)

CGX6SisW8AA_QOQ

The off-square dividing make this look as if it’s trying to be a pie chart, but it isn’t. Not only are these not percentages of the same thing and so make no sense as a pie, the colour sections aren’t even scaled in proportion to the numbers (whether you look at angle or area).

Stat of the Week Competition: May 30 – June 5 2015

Each week, we would like to invite readers of Stats Chat to submit nominations for our Stat of the Week competition and be in with the chance to win an iTunes voucher.

Here’s how it works:

  • Anyone may add a comment on this post to nominate their Stat of the Week candidate before midday Friday June 5 2015.
  • Statistics can be bad, exemplary or fascinating.
  • The statistic must be in the NZ media during the period of May 30 – June 5 2015 inclusive.
  • Quote the statistic, when and where it was published and tell us why it should be our Stat of the Week.

Next Monday at midday we’ll announce the winner of this week’s Stat of the Week competition, and start a new one.

(more…)

Stat of the Week Competition Discussion: May 30 – June 5 2015

If you’d like to comment on or debate any of this week’s Stat of the Week nominations, please do so below!