Posts from April 2015 (35)

April 7, 2015

What’s wrong with this picture?

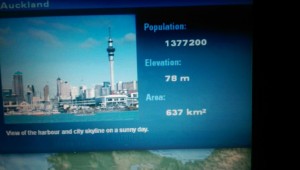
So, I was on a plane from Sydney yesterday that was old enough they told us to switch off our books half an hour before landing. As a result, I actually looked at the Auckland information on the flight map channel (photo taken after we were allowed technology, naturally):

CB6H2HkUoAAnW3i

It’s interesting to see where these numbers come from, given all the different ways these things can be defined. Two of these numbers are inconsistent with each other and somewhat obsolete, and the third isn’t even wrong.

According to the Google, the population number 1,377,200 is the June 2011 estimate of the urban population of the Auckland metropolitan area.  Ok, that’s a bit old but so was the plane. Slightly more strange is that StatsNZ thinks the urban Auckland population at 30 June 2011 was 1,351,200, but that’s probably a matter of projections being made in advance and then adjusted as more information comes in. The current (June 2014) estimate is 1,413,500.

So if the population is urban Auckland, what’s the area? With a bit of searching, you can find it’s the area of the old Auckland City, the central Auckland isthmus plus various islands. Auckland City had a population of 450,000 when it was absorbed into the Supercity in 2010. The population and area numbers are for very different entities, and the population number, although old, dates from after the area number became completely obsolete.

The area that goes with the 1,377,200 number is 1,102.9km2, the size of the Statistical Urban Area. You could reasonably want the urbanised area (483km2) or the Metropolitan Urban Limits (560km2) as better summaries of the size of Auckland, but they don’t match the quoted population.

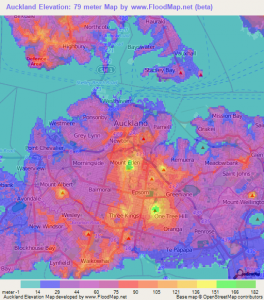
That leaves elevation. The picture next to the statistics shows that 78m is not a completely satisfactory characterisation of the elevation of Auckland. The blue stuff with boats floating on it is at sea level (up to tidal variation). Here’s a map (from FloodMap.net) of Auckland elevation; the change from pink to red is at 75m.

www.floodmap

Overall, population and area, which could have multiple satisfactory definitions, are defined incompatibly with each other.  Elevation doesn’t really have a satisfactory definition, but isn’t 78m.
 

April 6, 2015

Stat of the Week Competition: April 4 – 10 2015

Each week, we would like to invite readers of Stats Chat to submit nominations for our Stat of the Week competition and be in with the chance to win an iTunes voucher.

Here’s how it works:

  • Anyone may add a comment on this post to nominate their Stat of the Week candidate before midday Friday April 10 2015.
  • Statistics can be bad, exemplary or fascinating.
  • The statistic must be in the NZ media during the period of April 4 – 10 2015 inclusive.
  • Quote the statistic, when and where it was published and tell us why it should be our Stat of the Week.

Next Monday at midday we’ll announce the winner of this week’s Stat of the Week competition, and start a new one.

(more…)

Stat of the Week Competition Discussion: April 4 – 10 2015

If you’d like to comment on or debate any of this week’s Stat of the Week nominations, please do so below!

April 1, 2015

NRL Predictions for Round 5

Team Ratings for Round 5

The basic method is described on my Department home page.

Here are the team ratings prior to this week’s games, along with the ratings at the start of the season.

Current Rating Rating at Season Start Difference
Rabbitohs 11.79 13.06 -1.30
Roosters 11.30 9.09 2.20
Cowboys 4.98 9.52 -4.50
Storm 4.64 4.36 0.30
Broncos 4.61 4.03 0.60
Panthers 4.41 3.69 0.70
Warriors 2.15 3.07 -0.90
Knights 1.72 -0.28 2.00
Bulldogs 1.03 0.21 0.80
Sea Eagles -0.61 2.68 -3.30
Dragons -3.09 -1.74 -1.40
Eels -3.63 -7.19 3.60
Raiders -7.94 -7.09 -0.90
Wests Tigers -9.21 -13.13 3.90
Titans -9.71 -8.20 -1.50
Sharks -11.11 -10.76 -0.40


Performance So Far

So far there have been 32 matches played, 19 of which were correctly predicted, a success rate of 59.4%.

Here are the predictions for last week’s games.

Game Date Score Prediction Correct
1 Eels vs. Rabbitohs Mar 27 29 – 16 -16.40 FALSE
2 Wests Tigers vs. Bulldogs Mar 27 24 – 25 -8.30 TRUE
3 Dragons vs. Sea Eagles Mar 28 12 – 4 -0.70 FALSE
4 Knights vs. Panthers Mar 28 26 – 14 -1.60 FALSE
5 Sharks vs. Titans Mar 28 22 – 24 2.20 FALSE
6 Roosters vs. Raiders Mar 29 34 – 6 21.30 TRUE
7 Warriors vs. Broncos Mar 29 16 – 24 3.10 FALSE
8 Cowboys vs. Storm Mar 30 18 – 17 3.80 TRUE


Predictions for Round 5

Here are the predictions for Round 5. The prediction is my estimated expected points difference with a positive margin being a win to the home team, and a negative margin a win to the away team.

Game Date Winner Prediction
1 Bulldogs vs. Rabbitohs Apr 03 Rabbitohs -7.80
2 Titans vs. Broncos Apr 03 Broncos -11.30
3 Knights vs. Dragons Apr 04 Knights 7.80
4 Sea Eagles vs. Raiders Apr 04 Sea Eagles 10.30
5 Roosters vs. Sharks Apr 05 Roosters 25.40
6 Eels vs. Wests Tigers Apr 06 Eels 8.60
7 Panthers vs. Cowboys Apr 06 Panthers 2.40
8 Storm vs. Warriors Apr 06 Storm 6.50


Super 15 Predictions for Round 8

Team Ratings for Round 8

The basic method is described on my Department home page.

Here are the team ratings prior to this week’s games, along with the ratings at the start of the season.

Current Rating Rating at Season Start Difference
Crusaders 8.34 10.42 -2.10
Waratahs 8.34 10.00 -1.70
Hurricanes 6.07 2.89 3.20
Brumbies 4.50 2.20 2.30
Chiefs 3.86 2.23 1.60
Bulls 2.95 2.88 0.10
Sharks 2.26 3.91 -1.70
Stormers 1.68 1.68 -0.00
Blues 0.02 1.44 -1.40
Highlanders -0.23 -2.54 2.30
Lions -3.78 -3.39 -0.40
Force -4.56 -4.67 0.10
Cheetahs -7.05 -5.55 -1.50
Rebels -7.53 -9.53 2.00
Reds -7.87 -4.98 -2.90


Performance So Far

So far there have been 47 matches played, 31 of which were correctly predicted, a success rate of 66%.

Here are the predictions for last week’s games.

Game Date Score Prediction Correct
1 Hurricanes vs. Rebels Mar 27 36 – 12 17.20 TRUE
2 Reds vs. Lions Mar 27 17 – 18 0.70 FALSE
3 Chiefs vs. Cheetahs Mar 28 37 – 27 16.30 TRUE
4 Highlanders vs. Stormers Mar 28 39 – 21 0.50 TRUE
5 Waratahs vs. Blues Mar 28 23 – 11 13.00 TRUE
6 Sharks vs. Force Mar 28 15 – 9 12.20 TRUE
7 Bulls vs. Crusaders Mar 28 31 – 19 -2.70 FALSE


Predictions for Round 8

Here are the predictions for Round 8. The prediction is my estimated expected points difference with a positive margin being a win to the home team, and a negative margin a win to the away team.

Game Date Winner Prediction
1 Hurricanes vs. Stormers Apr 03 Hurricanes 8.90
2 Rebels vs. Reds Apr 03 Rebels 4.30
3 Chiefs vs. Blues Apr 04 Chiefs 7.80
4 Brumbies vs. Cheetahs Apr 04 Brumbies 16.00
5 Sharks vs. Crusaders Apr 04 Crusaders -1.60
6 Lions vs. Bulls Apr 04 Bulls -2.70