April 9, 2015
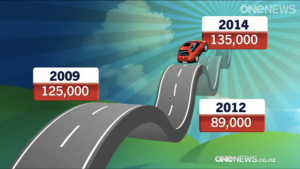
Graph of the week
Number of learner license tests taken in New Zealand, according to One News.
We’ll follow up to see if the future prediction part of the graph turns out to be correct.
Thomas Lumley (@tslumley) is Professor of Biostatistics at the University of Auckland. His research interests include semiparametric models, survey sampling, statistical computing, foundations of statistics, and whatever methodological problems his medical collaborators come up with. He also blogs at Biased and Inefficient See all posts by Thomas Lumley »

It would be really good to see restricted license test numbers (not learner licences). It seems to be taking at least 3 goes for my sons and their friends to get their restrictive — regardless of how good they are at driving — and probably the average is nearer 4 or 5. That level of turnover must be adding to the workload, (and to the profitability of the operation.)
10 years ago
The restricted-license test pass rate has gone from just under 50% to just over 50%:
http://www.aa.co.nz/drivers/driving-lessons/driving-test-pass-rates-nationwide/
I don’t know if there’s data on the distribution of number of repeats, but at 50% average pass rate there can’t be more than half of people taking three or more attempts.
10 years ago
But different groups (e.g. teenage boys) may have a different probability of passing from the average.
10 years ago
True, that.
Teenage boys can’t be that much less than half the test-takers, so the bound would still be fairly strong, but not as strong as I said.
10 years ago
On page you gave it does actually show the data for the restricted test – teens make up about 54% of the people taking a restricted license test – although I would guess it’s weighted towards boys. And teens actually do better than average.
10 years ago
Do you have any idea where they got this data from, and if it is possible to get a full copy of the dataset… could be really interesting for discussing with our stats students at secondary level as it is very relevant for them.
10 years ago
I expect you could just ask NZTA for the raw data: there seem to be lots of news stories using the data, so it must be fairly conveniently available. You could mention the OIA if they weren’t cooperative initially.
10 years ago
Cool, thanks… I’ll see how I get on.
10 years ago
One of the other teachers managed to get all the data, for anyone that is interested it is avaialbe here: http://www.jake4maths.com/grapher/?folder=demo&dataset=Driver+Tests.csv
10 years ago