Posts from March 2015 (48)

March 14, 2015

Ok, but it matters in theory

Some discussion on Twitter about political polling and whether political journalists understood the numbers led to the question:

If you poll 500 people, and candidate 1 is on 35% and candidate 2 is on 30%, what is the chance candidate 2 is really ahead?

That’s the wrong question. Well, no, actually it’s the right question, but it is underdetermined.

The difficulty is related to the ‘base-rate‘ problem in testing for rare diseases: it’s easy to work out the probability of the data given the way the world is, but you want the probability the world is a certain way given the data. These aren’t the same.

If you want to know how much variability there is in a poll, the usual ‘maximum margin of error’ is helpful.  In theory, over a fairly wide range of true support, one poll in 20 will be off by more than this, half being too high and half being too low. In theory it’s 3% for 1000 people, 4.5% for 500. For minor parties, I’ve got a table here. In practice, the variability in NZ polls is larger than in theoretically perfect polls, but we’ll ignore that here.

If you want to know about change between two polls, the margin of error is about 1.4 times higher. If you want to know about difference between two candidates, the computations are trickier. When you can ignore other candidates and undecided voters, the margin of error is about twice the standard value, because a vote added to one side must be taken away from the other side, and so counts twice.

When you can’t ignore other candidates, the question isn’t exactly answerable without more information, but Jonathan Marshall has a nice app with results for one set of assumptions. Approximately, instead of the margin of error for the difference being (2*square root (1/N)) as in the simple case, you replace the 1 by the sum of the two candidate estimates, so  (2*square root (0.35+0.30)/N).  The margin of error is about 7%.  If the support for the two candidates were equal, there would be about a 9% chance of seeing candidate 1 ahead of candidate 2 by at least 5%.

All this, though, doesn’t get you an answer to the question as originally posed.

If you poll 500 people, and candidate 1 is on 35% and candidate 2 is on 30%, what is the chance candidate 2 is really ahead?

This depends on what you knew in advance. If you had been reasonably confident that candidate 1 was behind candidate 2 in support you would be justified in believing that candidate 1 had been lucky, and assigning a relatively high probability that candidate 2 is really ahead. If you’d thought it was basically impossible for candidate 2 to even be close to candidate 1, you probably need to sit down quietly and re-evaluate your beliefs and the evidence they were based on.

The question is obviously looking for an answer in the setting where you don’t know anything else. In the general case this turns out to be, depending on your philosophy, either difficult to agree on or intrinsically meaningless.  In special cases, we may be able to agree.

If

  1. for values within the margin of error, you had no strong belief that any value was more likely than any other
  2. there aren’t values outside the margin of error that you thought were much more likely than those inside

we can roughly approximate your prior beliefs by a flat distribution, and your posterior beliefs by a Normal distribution with mean at the observed data value and with standard error equal to the margin of error.

In that case, the probability of candidate 2 being ahead is 9%, the same answer as the reverse question.  You could make a case that this was a reasonable way to report the result, at least if there weren’t any other polls and if the model was explicitly or implicitly agreed. When there are other polls, though, this becomes a less convincing argument.

TL;DR: The probability Winston is behind given that he polls 5% higher isn’t conceptually the same as the probability that he polls 5% higher given that he is behind.  But, if we pretend to be in exactly the right state of quasi-ignorance, they come out to be the same number, and it’s roughly 1 in 10.
March 13, 2015

Clinical trial reporting still not happening

According to a paper in the New England Journal of Medicine, about 20% of industry-funded clinical trials registered in the United States failed to report their summary results with no legally acceptable reason for delay. That’s obviously not good enough, and this sort of thing is why people don’t like drug companies.

As the paper says

On the basis of this review, we estimated that during the 5-year period, approximately 79 to 80% of industry-funded trials reported summary results or had a legally acceptable reason for delay. In contrast, only 49 to 50% of NIH-funded trials and 42 to 45% of those funded by other government or academic institutions reported results or had legally acceptable reasons for delay.

Um. Yes. <coughs nervously> <shuffles feet>

via Derek Lowe

Feel-good gene?

From Stuff

Suffering anxiety, is not a mark of character, but at least in part to do with the genetic lottery, he says.

“About 20 per cent of adult Americans have this mutation,” Professor Friedman says of those who produce more anandamide, whose name is taken from the Sanskrit word for bliss.

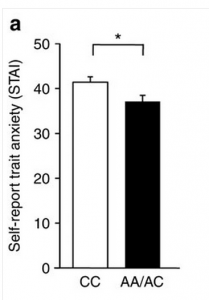
There’s good biological research behind this story, on how the gene works in both mice and people, but the impact is being oversold. The human data on anxiety in the paper look like

feelgood

Combining this small difference with the claim that 20% of people  in the US carry the variant, it would explain about 1% of the population variation in the anxiety questionnaire score. Probably less of the variation in having/not having clinically diagnosable anxiety.

The story continues

“Those who do [have this mutation] may also be less likely to become addicted to marijuana and, possibly, other drugs – presumably because they don’t need the calming effects that marijuana provides.”

The New York Times version mentioned a study of marijuana dependence, which found people with the low-anxiety mutation were less likely to be dependent. However, for other drugs the opposite has been found:

Here, we report a naturally occurring single nucleotide polymorphism in the human FAAH gene, 385A, that is strongly associated with street drug use and problem drug/alcohol use.

People with the mutant, A, version of the gene, the low-anxiety variant, were more likely to have drug problems.  In fact, even the study that found (weak) evidence for lower rates of marijuana dependence found much stronger evidence of higher rates of sedative dependence.

Simple, binary, genetic explanations for complex human conditions are always tempting, but usually wrong.

March 12, 2015

Briefly

  • There will be SCIENCE at the Auckland Festival on Saturday: Dr Michelle ‘Nanogirl’ Dickinson blowing things up, Dr Siouxsie Wiles (and artists, and you) lighting things up, and panel discussions.
  • ‘In the 17th century, another genre of paintings emerged, showing public administrators holding their books open for all to see. More than 100 of these paintings were produced between 1600 and 1800. Transparency became a cultural ideal worthy of art.’ Jacob Soll writing in the Boston Globe about the financial data revolution of the 16th century.
  • “The next big milestone for the project is to get a judge to rule in favor of a tenant based on Heat Seek data. That would set a precedent that the courts see these devices as reliable and unbiased evidence.” New York, like many US cities, has temperature standards for apartments where the landlord controls the heating system. Heat Seek wants to provide independent data using internet-connected thermometers.
  • Does the popularity of party leaders affect voting? In the UK it seems the answer is “sometimes, a bit”.  (via Alex Harrowell)

Election donation maps

There are probably some StatChat readers who don’t read the NZ Herald, so I’ll point out that I have a post on the data blog about election donations.

Variation and mean

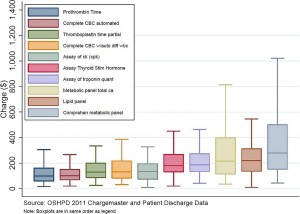
A lot of statistical reporting focuses on means, or other summaries of where a distribution lies. Often, though, variation is important.  Vox.com has a story about variation in costs of lab tests at California hospitals, based on a paper in BMJ OpenVox says

The charge for a lipid panel ranged from $10 to $10,169. Hospital prices for a basic metabolic panel (which doctors use to measure the body’s metabolism) were $35 at one facility — and $7,303 at another

These are basically standard lab tests, so there’s no sane reason for this sort of huge variation. You’d expect some variation with volume of tests and with location, but nothing like what is seen.

What’s not clear is how much this is really just variation in how costs are attributed. A hospital needs a blood lab, which has a lot of fixed costs. Somehow these costs have to be spread over individual tests, but there’s no unique way to do this.  It would be interesting to know if the labs with high charges for one test tend to have high charges for others, but the research paper doesn’t look at relationships between costs.

The Vox story also illustrates a point about reporting, with this graph

 F1.large-1

If you look carefully, there’s something strange about the graph. The brown box second from the right is ‘lipid panel’, and it goes up to a bit short of $600, not to $10169. Similarly, the ‘metabolic panel’, the right-most box, goes up to $1000 on the graph and $7303 in the story.

The graph is taken from the research paper. In the research paper it had a caption explaining that the ‘whiskers’ in the box plot go to the 5th and 95th percentiles (a non-standard but reasonable choice). This caption fell off on the way to Vox.com, and no-one seems to have noticed.

March 10, 2015

NRL Predictions for Round 2

Team Ratings for Round 2

The basic method is described on my Department home page.

Here are the team ratings prior to this week’s games, along with the ratings at the start of the season.

Current Rating Rating at Season Start Difference
Rabbitohs 14.70 13.06 1.60
Roosters 10.95 9.09 1.90
Cowboys 7.66 9.52 -1.90
Storm 4.72 4.36 0.40
Panthers 3.65 3.69 -0.00
Broncos 2.40 4.03 -1.60
Warriors 2.40 3.07 -0.70
Knights 0.39 -0.28 0.70
Bulldogs 0.25 0.21 0.00
Sea Eagles 0.21 2.68 -2.50
Dragons -2.10 -1.74 -0.40
Eels -4.73 -7.19 2.50
Raiders -6.84 -7.09 0.20
Titans -8.84 -8.20 -0.60
Sharks -11.01 -10.76 -0.30
Wests Tigers -12.49 -13.13 0.60


Performance So Far

So far there have been 8 matches played, 5 of which were correctly predicted, a success rate of 62.5%.

Here are the predictions for last week’s games.

Game Date Score Prediction Correct
1 Broncos vs. Rabbitohs Mar 05 6 – 36 -6.00 TRUE
2 Eels vs. Sea Eagles Mar 06 42 – 12 -6.90 FALSE
3 Cowboys vs. Roosters Mar 07 4 – 28 3.40 FALSE
4 Knights vs. Warriors Mar 07 24 – 14 0.70 TRUE
5 Titans vs. Wests Tigers Mar 07 18 – 19 7.90 FALSE
6 Panthers vs. Bulldogs Mar 08 24 – 18 6.50 TRUE
7 Sharks vs. Raiders Mar 08 20 – 24 -0.70 TRUE
8 Dragons vs. Storm Mar 09 4 – 12 -3.10 TRUE


Predictions for Round 2

Here are the predictions for Round 2. The prediction is my estimated expected points difference with a positive margin being a win to the home team, and a negative margin a win to the away team.

Game Date Winner Prediction
1 Bulldogs vs. Eels Mar 13 Bulldogs 8.00
2 Sharks vs. Broncos Mar 13 Broncos -10.40
3 Cowboys vs. Knights Mar 14 Cowboys 10.30
4 Panthers vs. Titans Mar 14 Panthers 15.50
5 Sea Eagles vs. Storm Mar 14 Storm -1.50
6 Rabbitohs vs. Roosters Mar 15 Rabbitohs 6.70
7 Raiders vs. Warriors Mar 15 Warriors -5.20
8 Wests Tigers vs. Dragons Mar 16 Dragons -7.40


Super 15 Predictions for Round 5

Team Ratings for Round 5

The basic method is described on my Department home page.

Here are the team ratings prior to this week’s games, along with the ratings at the start of the season.

Current Rating Rating at Season Start Difference
Waratahs 8.68 10.00 -1.30
Crusaders 7.07 10.42 -3.30
Hurricanes 5.52 2.89 2.60
Brumbies 3.75 2.20 1.50
Stormers 3.54 1.68 1.90
Chiefs 3.25 2.23 1.00
Bulls 2.81 2.88 -0.10
Sharks 2.06 3.91 -1.90
Blues -0.33 1.44 -1.80
Highlanders -1.70 -2.54 0.80
Lions -3.57 -3.39 -0.20
Force -5.08 -4.67 -0.40
Cheetahs -5.29 -5.55 0.30
Reds -6.43 -4.98 -1.40
Rebels -7.29 -9.53 2.20


Performance So Far

So far there have been 27 matches played, 17 of which were correctly predicted, a success rate of 63%.

Here are the predictions for last week’s games.

Game Date Score Prediction Correct
1 Chiefs vs. Highlanders Mar 06 17 – 20 10.60 FALSE
2 Brumbies vs. Force Mar 06 27 – 15 13.00 TRUE
3 Blues vs. Lions Mar 07 10 – 13 9.30 FALSE
4 Reds vs. Waratahs Mar 07 5 – 23 -10.10 TRUE
5 Cheetahs vs. Bulls Mar 07 20 – 39 -2.10 TRUE
6 Stormers vs. Sharks Mar 07 29 – 13 4.00 TRUE


Predictions for Round 5

Here are the predictions for Round 5. The prediction is my estimated expected points difference with a positive margin being a win to the home team, and a negative margin a win to the away team.

Game Date Winner Prediction
1 Hurricanes vs. Blues Mar 13 Hurricanes 9.80
2 Force vs. Rebels Mar 13 Force 6.20
3 Crusaders vs. Lions Mar 14 Crusaders 15.10
4 Highlanders vs. Waratahs Mar 14 Waratahs -5.90
5 Reds vs. Brumbies Mar 14 Brumbies -6.20
6 Stormers vs. Chiefs Mar 14 Stormers 4.80
7 Cheetahs vs. Sharks Mar 14 Sharks -3.30


March 9, 2015

Stat of the Week Competition: March 7 – 13 2015

Each week, we would like to invite readers of Stats Chat to submit nominations for our Stat of the Week competition and be in with the chance to win an iTunes voucher.

Here’s how it works:

  • Anyone may add a comment on this post to nominate their Stat of the Week candidate before midday Friday March 13 2015.
  • Statistics can be bad, exemplary or fascinating.
  • The statistic must be in the NZ media during the period of March 7 – 13 2015 inclusive.
  • Quote the statistic, when and where it was published and tell us why it should be our Stat of the Week.

Next Monday at midday we’ll announce the winner of this week’s Stat of the Week competition, and start a new one.

(more…)

Stat of the Week Competition Discussion: March 7 – 13 2015

If you’d like to comment on or debate any of this week’s Stat of the Week nominations, please do so below!