Posts from January 2015 (38)

January 27, 2015

Benadryl and Alzheimers

I expected the Herald story “Hay fever pills linked to Alzheimer’s risk – study” to be the usual thing, where a fishing expedition found a marginal correlation in low-quality data.  It isn’t.

The first thing I noticed  when I found the original article is that I know several of the researchers. On the one hand that’s a potential for bias, on the other hand, I know they are both sensible and statistically knowledgeable. The study has good quality data: the participants are all in one of the Washington HMOs, and there is complete information on what gets prescribed for them and whether they fill the prescriptions.

One of the problems with drug:disease associations is confounding by indication. As Samuel Goldwyn observed, “Any man who goes to a psychiatrist needs to have his head examined”, and more generally the fact that medicine is given to sick people tends to make it look bad.  In this case, however, the common factor between the medications being studied is an undesirable side-effect for most of them, unrelated to the reason they are prescribed.  In addition to reducing depression or preventing allergic reactions, these drugs also block part of the effect of the neurotransmitter acetylcholine. The association remained just as strong when recent drug use was excluded, or when antidepressant drugs were excluded, so it probably isn’t that early symptoms of Alzheimer’s lead to treatment.

The association replicates results found previously, and is quite strong, about four times the standard error (“4σ”) or twice the ‘margin of error’. It’s not ridiculously large, but is enough to be potentially important: a relative rate of about 1.5.

It’s still entirely possible that the association is due to some other factor, but the possibility of a real effect isn’t completely negligible. Fortunately, many of the medications involved are largely obsolete: modern hayfever drugs (such as fexofenadine, ‘Telfast’) don’t have anticholinergic activities, and nor do the SSRI antidepressants. The exceptions are tricyclic antidepressants used for chronic pain (where it’s probably worth the risk) and the antihistamines used as non-prescription sleep aids.

Meet Statistics summer scholar Eric Lim

IMG_0069Every year, the Department of Statistics offers summer scholarships to a number of students so they can work with staff on real-world projects. Eric, right, is working on a project called Accessible graphics for data on maps with Professor Chris Wild. Eric explains:

“I am working on an easy-to-use data-analysis system called iNZight  that has been developed by Professor Chris Wild and his students at the University of Auckland. The primary purpose of iNZight is to allow students to experience exploring many different types of statistics, and it has been successfully deployed in many situations to produce significant results.

“My main task is to implement a simple geographical information system (GIS) in iNZight so that students can draw maps, visualise geographical information, learn and interpret patterns they reveal.

“Knowing where things happen is important, especially in looking for or displaying spatial relationships in areas such as crime, health, education, population, environmental resource management, market analysis, highway maintenance, accident monitoring, and emergency planning and routing.

“Geographical data are also very interesting and fun to look at, and I would like to present iNZight users with visually appealing and informative maps. A picture is worth a thousand words!

“I am from South Korea. I studied applied mathematics and statistics for my undergraduate degree, and recently finished my honours degree in statistics at the University of Auckland. I am hoping to study a masters in 2015.

“I am fascinated by patterns hidden inside data that can only be seen by using appropriate statistical methods. Learning different statistical techniques to effectively bring out the patterns is naturally my biggest interest and passion.

“I particularly love statistics because of its wide range of use in many areas such as finance, ecology, computing and many more.”


School fee/real-estate arithmetic

There’s an interesting piece in the Herald arguing that the effective school fees you pay by living in one of the top school zones in Auckland aren’t great value, and that you’d be better off just paying private-school fees explicitly. It’s a good point, but I think the calculations in the article are missing something:

Where a school zone boundary sliced through the middle of a suburban street, in-zone houses were up to $272,000 more expensive than comparable properties on the other side of the road.

“Over the life of a 20-year mortgage, at a fixed mortgage rate of 6.5 per cent, the extra $272,000 it costs to buy a home ‘in-zone’, with interest, equates to an outlay of $486,710. That’s almost half a million dollars.

That’s compared to private-school fees that could easily total “more than $100,000 per student over five years”.

There are two points that don’t get addressed explicitly in the article. Firstly, many people have more than one child. Secondly, the money spent on school-zone real estate isn’t gone, it’s a speculative investment.

Using their figures (because I’m lazy), if you subtract two kids at $100,000 school fees from the $486,710 real-estate plus interest you get $286,710. If the real-estate premium for the school zones keeps up with inflation, you basically break even, with the possibility of a big loss (if boundaries are redrawn) or a big gain (if prices keep going up).

If you’re the sort of person the article is aimed at, there’s a good chance you’ve already got more of your money in Auckland real estate than is ideal, so speculating on the Grammar Zone premium might not be a good investment, but it’s not self-evidently bad.

There are a couple of surprising points about the article. First, you would hope this is the sort of calculation anyone would already be doing before planning to spend the thick end of million bucks. Second, the fact that real-estate prices can go up as well as down is not something the Herald usually misses.

January 26, 2015

Meet Statistics summer scholar Rahul Singhal 

Rahul SinghalEvery year, the Department of Statistics at the University of Auckland offers summer scholarships to a number of students so they can work with staff on real-world projects. Rahul Singhal, right, is working on a project called Developing Bias Weights for the New Zealand Longitudinal Census with Professor Alan Lee. Rahul explains:

“The project attempts to adjust for linkage bias in the New Zealand longitudinal census – to reduce this bias as much as possible.

“When we link people from one census to another, those people who have been linked may differ from those that could not be linked, that is, the non-linked people may have different characteristics from the linked people.

“The bias can result in a tendency to overestimate or underestimate important relationships between variables, such as the effect of a person’s occupation on mortality risk.  This tendency could potentially result in incorrect conclusions. Thus, this project could be very helpful for other projects that use the New Zealand Longitudinal Census to investigate the effect of different variables.

“I have just finished my conjoint BA/BCom degree in Statistics, Economics, Accounting and Finance.  Statistics has interested me ever since I took the Statistics 108 course, Statistics for Commerce, in which I learned about the power and flexibility of statistics. It is the main reason why I decided to go from a single degree to a conjoint degree.

“I don’t have too much planned for my summer break, just visiting family in India, as I haven’t seen them for a few years.”


January 24, 2015

Measuring what you care about

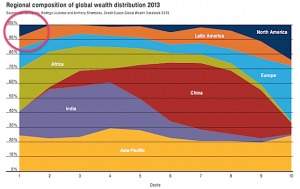
Via Felix Salmon, here’s a chart from Credit Suisse that’s been making the headlines recently, in the Oxfam report on global wealth.  The chart shows where in the world people live for each of the ‘wealth’ deciles, and I’ve circled the most interesting piece.

wealth

About 10% of the least wealthy people in the world live in North America. This isn’t (just) Mexico, Guatemala, Nicaragua, etc, it’s also the US, because some people in the US have really big debts.

If you are genuinely poor, you can’t have hundreds of thousands of dollars of negative wealth because no-one would give you that sort of money. Compared to a US law-school graduate with student loans, you’re wealthy.  This is obviously a dumb way to define wealth. Also, as I’ve argued on the ‘net tax’ issue, cumulative percentages just don’t work usefully as summaries when some of the numbers are negative.

This doesn’t mean wealth inequality doesn’t exist (boy, does it) or doesn’t matter, but it does mean summaries like the Credit Suisse one don’t capture it. If you wanted to capture the sort of wealth inequality worth worrying about, you’d need to think about what it really meant and why it was a problem separately from income inequality (which is much easier to define).

There seem to be two concerns with wealth inequality that people on a reasonably broad political spectrum might care about, if we stipulate that redistributive international taxation is not on the agenda:

  • transfer of wealth from parents to children leads to social stratification
  • high concentrations of wealth give some people too much power (and more so in societies more corrupt than NZ).

Both of these are non-linear ($200 isn’t twice as much as $100 in any meaningful sense) and they both depend on where you are ($20,000 will get you much further in Nigeria than in Rhode Island). There probably isn’t going to be a good way to look at global wealth inequality. Within countries, it’s probably feasible but it will still take some care and I expect it will be necessary to discount debts quite a lot.  If you owe the bank $10, you’re not wealthy, but if you owe the bank $10 million, you probably are.

January 23, 2015

Where did I come from?

One of the popular uses of recreational genotyping is ancestry determination.  Everyone inherits mitochondria only from our mothers, who got it from their mothers, and so on. Your mitochondrial DNA is a good match for your greatnth-grandmother, and people will sell you stories about where she came from.  In men, the Y chromosome does the same job for male-line ancestry.

When you go back even 50 generations (eg, very roughly to the settlement of New Zealand, or the Norman Conquest), you have approximately a million billion ancestors, obviously with rather a lot of overlap. You might wonder if the single pure female line ancestor was representative, and how informative she was about your overall ancestry.

In a new paper in the American Journal of Human Genetics, researchers looked at what you’d conclude about ancestry from the mitochondrial DNA compared to what you’d conclude from the whole genome.  They weren’t trying to get this very precise, just down to what continent most of your ancestors came from. This is what they found:

Continental-ancestry proportions often varied widely among individuals sharing the same mtDNA haplogroup. For only half of mtDNA haplogroups did the highest average continental-ancestry proportion match the highest continental-ancestry proportion of a majority of individuals with that haplogroup. Prediction of an individual’s mtDNA haplogroup from his or her continental-ancestry proportions was often incorrect. Collectively, these results indicate that for most individuals in the worldwide populations sampled, mtDNA-haplogroup membership provides limited information about either continental ancestry or continental region of origin.

The agreement was better than chance — there is some information about ancestry from just your greatnth-grandmother — but not very good. It wasn’t even a particularly severe test, since the samples were a set that had been previously selected to expand the diversity of genome sequencing and were deliberately spread out around the world.  In a random group of young adults from London or New York or Rio you’d expect to do worse.

Meet Statistics summer scholar Bo Liu

Photo Bo LiuEvery year, the Department of Statistics offers summer scholarships to a number of students so they can work with staff on real-world projects. Bo, right, is working on a project called Construction of life-course variables for the New Zealand Longitudinal Census (NZLC) with Roy Lay-Yee, Senior Research Fellow at the COMPASS Research Centre, University of Auckland, and Professor Alan Lee of Statistics. Bo explains:

“The New Zealand Longitudinal Census has linked individuals across the 1981-2006 New Zealand censuses. This enables the assessment of life-course resources with various outcomes.

“I need to create life-course variables such as socio-economic status, health, education, work, family ties and cultural identity from the censuses. Sometimes such information is not given directly in the census questions, but several pieces of information need to be combined together.

“An example is the overcrowding index that measures the personal living space. We need to combine the age, partnership status of the residents and number of bedrooms in each dwelling to derive the index.

“Also, the format of the questionnaire as well as the answers used in each census were rather different, so data-cleaning is required. I need to harmonise information collected in each census so that they are consistent and can be compared over different censuses. For example, in one census the gender might be given code ‘0’ and ‘1’ representing female and male, but in another census the gender was given code ‘1’ and ‘2’. Thus the code ‘1’ can mean quite different things in different censuses. My job is to find these differences and gaps in each census.

“The results of this project will enable future studies based on New Zealand longitudinal censuses, say, for example, the influence of life-courses variables on the risk of mortality. This project will also be a very good experience for my future career, since data-cleaning is a very important process that we were barely taught in our courses but will actually cost almost one-third of the time in most real-life projects. When we were studying statistics courses, most data sets we encountered were “toy” data sets that had fewer variables and observations and were clean. However, in real life, as in this case, we often meet with data that have millions of observations, hundreds of variables, and inconsistent variable specification and coding.

“I hold a Bachelor of Commerce in Accounting, Finance and Information Systems. I have just completed Postgraduate Diploma in Science, majoring in Statistics, and in 2015, I will be doing Master of Science in Statistics.

“When I was studying information systems, my lecturer introduced several statistical techniques to us and I was fascinated by what statistics is capable of in the decision-making process. For example, retailers can find out if a customer is pregnant purely based on her purchasing behaviour, so the retailers can send out coupons to increase their sales. It is amazing how we can use statistical techniques to find that little tiny bit of useful information in oceans of data. Statistics appeals to me as it is highly useful and applicable in almost every industry.

“This summer, I will spend some time doing road trips – hopefully I can make it to the South Island this time. I enjoy doing road trips alone every summer as I feel this is the best way to get myself refreshed and motivated for the next year.”


January 22, 2015

Do they know it’s Christmas time?

It’s (fortunately) out of season now, but there’s an interesting post on 538 about how Christmas music is detected, selected and played.

For example, the impact on algorithms that discover new hits or new performers:

The discovery algorithm searches for situations when the popularity of a song rises substantially faster than the popularity of the song’s artist. This becomes a problem in November, because Spotify starts seeing “Home for the Holidays” crooner Perry Como — who has been dead for 13 years — suddenly start behaving like an indie band out of Portland, Oregon, that’s about to make it big.

Meet Statistics summer scholar Yiying Zhang

yiyingEvery year, the Department of Statistics offers summer scholarships to a number of students so they can work with staff on real-world projects. Yiying, right, is working on a project called Modelling Competition and Dispersal in a Statistical Phylogeographic Framework with Dr Stéphane GuindonYiying explains.

 “The processes that govern the spatial distribution of species are complex. Traditional approaches in ecology generally rely on the hypothesis that adaptation to the environment is the main force driving this distribution.

“The supervisors of this project propose an alternative explanation that assumes that species are found in certain places simply because they were the first to colonise these locations during the course of evolution. They have recently designed a stochastic model that explains the observed spatial distribution of species using a combination of dispersal events (i.e., species migrating to new territories) and competition between species.

“In this project, I will run in silico [computer] experiments and analyse real data in order to validate the software Phyloland that implements our dispersal-competition model.

“To validate the model, we will randomly generate ‘true value’. Then we will use the model to make estimations of the true value. If the estimated values match the true value relatively closely, then the model is reliable.

“I am doing a BCom/BSc conjoint degree. My majors are Finance, Accounting and Statistics – 2015 is my fourth year. I am planning to do an Honours degree in statistics, so this summer research project is a very valuable experience for me.

“I enjoy statistics because it brings me closer to the real world. Sometimes, things are not simply what we see. Without data, we would never have convincing evidence about what is really happening. The amount of information out there is massive and statistics can help people tell how reliable a statement is. Studying statistics has helped me make better use of information and think more critically.

“My plans for summer include relaxing and reading more books. And having plenty of sleep.”


January 21, 2015

How to feel good about New Zealand

StatsChat criticises the NZ media a lot, but if you really want a target-rich zone, the place is the UK. Today, the Daily Express had this front page:

B703j6kIcAEiyUl

The biggest vote on this country’s ties to ­Brussels for 40 years saw 80 per cent say they no longer want to be in Europe, the ­Daily Express can reveal.

It marks a huge leap forward in this news­paper’s crusade to get Britain out of the EU.


This comes from a survey in three Conservative electorates in the southern UK (out of 650 electorates), where 100,000 questionnaires were distributed. About 12% said Britain should leave the EUK, about 3% were opposed, and the other 85% didn’t respond.

Other, better-conducted polling doesn’t find such a dramatic lead. Even a late-December poll by “Get Britain Out” found only 51% support for leaving the EU and consoled themselves by describing this as showing their campaign was gaining momentum.

(via @federicacocco)