Posts from October 2014 (47)

October 9, 2014

…and to divide the light from the darkness

Q: There’s a story that charging your phone in your bedroom make you fat.

A: Yes, there is.

Q: Why?

A: Because it looked like a good headline.

Q: No, why does it make you fat?

A: Melatonin. The theory is that any light at night time makes your body not produce enough melatonin and that this is bad.

Q: How much more did people who charged their phones in their bedroom end up weighing?

A: There weren’t any people involved.

Q: Ok, so they had mice with cellphones in their bedrooms?

A: Rats. And not cellphones.

Q: Some other light source of a similar brightness?

A: No.

Q: What, then?

A: They put melatonin in the rats’ drinking water.

Q: So that should make them lose weight. Did it?

A: Not that they reported.

Q: Can you work with me here?

A: They measured the conversion of fat under the rats’ skin from ‘white’ to ‘brown‘, which is theoretically relevant to energy use and perhaps to diabetes and heart disease. It’s interesting research. (abstract)

Q: So it could be relevant, but doesn’t the generalisation seems a bit indirect?

A: Yes, “a bit.”

Q: Do international patterns of cellphone use match patterns of obesity?

A: Not really, but maybe in East Asia they use different chargers or something.

Q: Is the LED on a charger really enough to make a difference?

A: That’s what the story lead implies, but the second paragraph talks about research involving phone screens, laptops, artificial lighting, and street lights, so I’m guessing there’s a bit of a bait and switch going on.

Q: Couldn’t it be enough? I mean, in nature, it would be completely dark at night, like they say.

A: Only up to a point. There was another relevant story today, too.
 

October 8, 2014

Communicating the obvious (to you)

From the Herald

People’s coffee-drinking habits are linked to their genes, scientists say.

A large-scale study, which analysed 20,000 regular coffee drinkers of European and African American ancestry, identified six new genetic variants associated with habitual coffee drinking.

What the story (and the press information) doesn’t say is how small the effects are: among regular coffee drinkers, each of these variants predicted a difference in average consumption of one or two cups per month. (research paper, paywalled)

The  researchers would think it’s obvious that the effects are going to be tiny, so it makes sense that they wouldn’t point this out explicitly. The journalists and publicists wouldn’t know, but there’s no reason they would think to ask.

What are CEOs paid; what should they be paid?

From Harvard Business Review, reporting on recent research

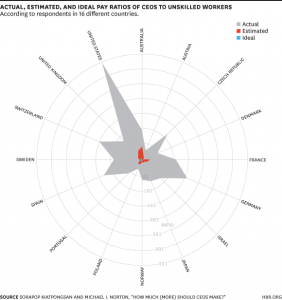
Using data from the International Social Survey Programme (ISSP) from December 2012, in which respondents were asked to both “estimate how much a chairman of a national company (CEO), a cabinet minister in a national government, and an unskilled factory worker actually earn” and how much each person should earn, the researchers calculated the median ratios for the full sample and for 40 countries separately.

The graph:

actualestimated


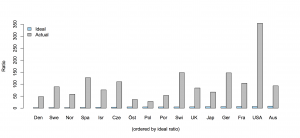
The radial graph exaggerates the differences, but they are already huge. Respondents dramatically underestimated what CEOs are actually paid, and still thought it was too much.  Here’s a barchart of the blue and grey data (the red data seems to only be available in the graph). Ordering by ideal pay ratio (rather than alphabetically) helps with the nearly-invisible blue bars: it’s interesting that Australia has the highest ideal ratio.

ceo

The findings are a contrast to foreign aid budgets, where the desired level of expenditure is less than the estimated level, but more than the actual level.  On the other hand, it’s less clear exactly what the implications are in the CEO case.


October 7, 2014

Currie Cup Predictions for Round 10

Team Ratings for Round 10

The basic method is described on my Department home page. I have made some changes to the methodology this year, including shrinking the ratings between seasons.

Here are the team ratings prior to this week’s games, along with the ratings at the start of the season.

Current Rating Rating at Season Start Difference
Western Province 7.02 3.43 3.60
Lions 4.39 0.07 4.30
Sharks 3.35 5.09 -1.70
Blue Bulls -0.18 -0.74 0.60
Cheetahs -1.89 0.33 -2.20
Pumas -7.97 -10.00 2.00
Griquas -8.90 -7.49 -1.40
Kings -15.13 -10.00 -5.10


Performance So Far

So far there have been 36 matches played, 27 of which were correctly predicted, a success rate of 75%.

Here are the predictions for last week’s games.

Game Date Score Prediction Correct
1 Sharks vs. Lions Oct 03 26 – 23 4.10 TRUE
2 Pumas vs. Blue Bulls Oct 03 6 – 37 0.80 FALSE
3 Cheetahs vs. Western Province Oct 04 29 – 34 -3.70 TRUE
4 Griquas vs. Kings Oct 04 45 – 25 10.00 TRUE


Predictions for Round 10

Here are the predictions for Round 10. The prediction is my estimated expected points difference with a positive margin being a win to the home team, and a negative margin a win to the away team.

Game Date Winner Prediction
1 Kings vs. Pumas Oct 10 Pumas -2.20
2 Lions vs. Cheetahs Oct 11 Lions 11.30
3 Western Province vs. Sharks Oct 11 Western Province 8.70
4 Blue Bulls vs. Griquas Oct 11 Blue Bulls 13.70


ITM Cup Predictions for Round 9

Team Ratings for Round 9

Here are the team ratings prior to Round 9, along with the ratings at the start of the season. I have created a brief description of the method I use for predicting rugby games. Go to my Department home page to see this.

Here are the team ratings prior to this week’s games, along with the ratings at the start of the season.

Current Rating Rating at Season Start Difference
Canterbury 13.83 18.09 -4.30
Tasman 12.17 5.78 6.40
Auckland 6.43 4.92 1.50
Taranaki 4.87 -3.89 8.80
Counties Manukau 3.79 2.40 1.40
Hawke’s Bay 1.86 2.75 -0.90
Otago -2.60 -1.45 -1.20
Northland -3.21 -8.22 5.00
Wellington -3.87 10.16 -14.00
Manawatu -4.03 -10.32 6.30
Waikato -6.62 -1.20 -5.40
Southland -7.33 -5.85 -1.50
Bay of Plenty -8.35 -5.47 -2.90
North Harbour -9.00 -9.77 0.80


Performance So Far

So far there have been 62 matches played, 39 of which were correctly predicted, a success rate of 62.9%.

Here are the predictions for last week’s games.

Game Date Score Prediction Correct
1 Hawke’s Bay vs. Wellington Oct 01 36 – 14 9.00 TRUE
2 Auckland vs. Waikato Oct 02 60 – 19 13.00 TRUE
3 Northland vs. North Harbour Oct 03 58 – 27 6.20 TRUE
4 Southland vs. Counties Manukau Oct 04 10 – 24 -5.80 TRUE
5 Bay of Plenty vs. Otago Oct 04 33 – 16 -5.00 FALSE
6 Canterbury vs. Tasman Oct 04 10 – 38 11.10 FALSE
7 Manawatu vs. Hawke’s Bay Oct 05 29 – 3 -5.50 FALSE
8 Wellington vs. Taranaki Oct 05 22 – 38 -1.70 TRUE


Predictions for Round 9

Here are the predictions for Round 9. The prediction is my estimated expected points difference with a positive margin being a win to the home team, and a negative margin a win to the away team.

Game Date Winner Prediction
1 Counties Manukau vs. Auckland Oct 08 Counties Manukau 1.40
2 Waikato vs. Bay of Plenty Oct 09 Waikato 5.70
3 Otago vs. Manawatu Oct 10 Otago 5.40
4 Wellington vs. North Harbour Oct 11 Wellington 9.10
5 Hawke’s Bay vs. Southland Oct 11 Hawke’s Bay 13.20
6 Auckland vs. Northland Oct 11 Auckland 13.60
7 Taranaki vs. Canterbury Oct 12 Canterbury -5.00
8 Tasman vs. Counties Manukau Oct 12 Tasman 12.40


Marriage equality maps

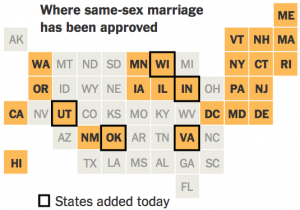
The US Supreme Court declined to review seven same-sex marriage decisions today. The StatsChat-relevant aspect is the flurry of maps this prompted:

I think the New York Times (via Twitter) is my favorite version: the square statebins use geography just as an index to make states easier to find, and (in contrast to the last statebins I linked to) they’ve moved Alaska to the right place

BzS1Q2zIQAAxW3Q


(more…)

Enumerating hard-to-reach populations

I’ve written before about how it’s hard to get accurate estimates of the size of small subpopulations, even with large, well-designed surveys.

Via the Herald

Mr Key said that was an emerging issue for New Zealand. “If I was to spell out to New Zealanders the exact number of people looking to leave and be foreign fighters, it would be larger, I think, than New Zealanders would expect that number to be.”

If the government really knows the ‘exact number’, there must have been a lot more domestic surveillance than we’ve been told about.

New Zealanders probably don’t have any very well formed expectations for that number, since we have basically no information to go on. My guess would be along the lines of “Not very many, but people are strange,  so probably some.” I’d be surprised if it were less than 10 or more than 1000.


October 6, 2014

Is Jon Snow dead?

From Richard Vale, at University of Canterbury

What’s this? You are claiming that we can use Bayesian statistics to predict Game of Thrones?
Probably not, no.

But we can try?
Yes!

Further coverage, and his full article

(via Dion O’Neale)

NZ voting cartograms

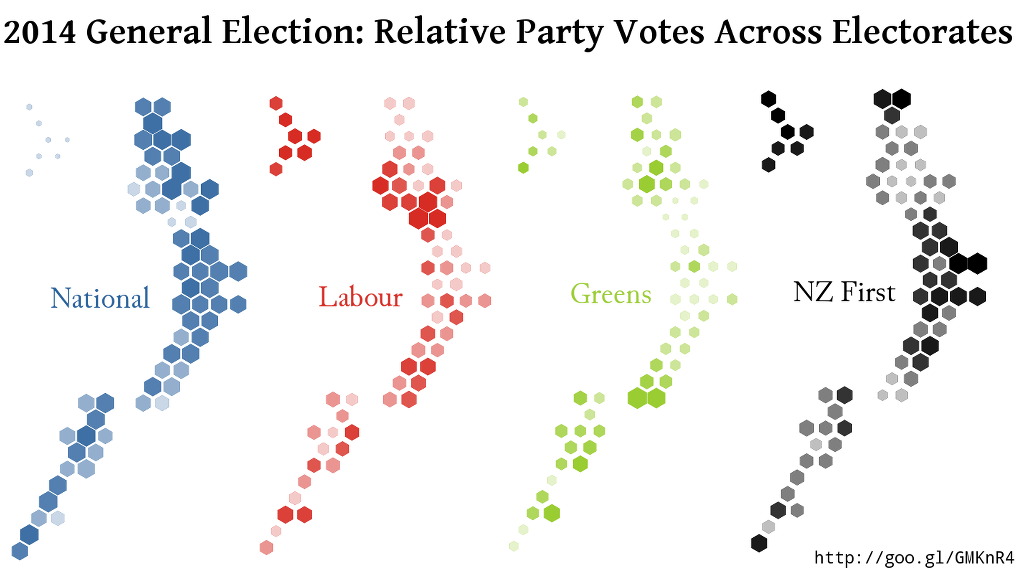
One of the problems with electoral maps is the ‘one cow, one vote’ effect: rural electorates are physically bigger, and so take up more of the map. When you combine that with the winner-take-all impact of simple colour schemes, it can look as though National won basically everything instead of just missing out on a majority.

Using a design by Chris McDowall that I linked earlier this year, David Friggens has mapped out the party votes across the country with equal area given to each electorate.  These maps show where the votes for each major party came from

big4


He also has maps for the minor parties, some of which have very localised support.

Stat of the Week Competition: October 4 – 10 2014

Each week, we would like to invite readers of Stats Chat to submit nominations for our Stat of the Week competition and be in with the chance to win an iTunes voucher.

Here’s how it works:

  • Anyone may add a comment on this post to nominate their Stat of the Week candidate before midday Friday October 10 2014.
  • Statistics can be bad, exemplary or fascinating.
  • The statistic must be in the NZ media during the period of October 4 – 10 2014 inclusive.
  • Quote the statistic, when and where it was published and tell us why it should be our Stat of the Week.

Next Monday at midday we’ll announce the winner of this week’s Stat of the Week competition, and start a new one.

(more…)