Posts from October 2014 (47)

October 15, 2014

ITM Cup Predictions for the ITM Cup Finals

Team Ratings for the ITM Cup Finals

Here are the team ratings prior to the ITM Cup Finals, along with the ratings at the start of the season. I have created a brief description of the method I use for predicting rugby games. Go to my Department home page to see this.

Here are the team ratings prior to this week’s games, along with the ratings at the start of the season.

Current Rating Rating at Season Start Difference
Canterbury 13.65 18.09 -4.40
Tasman 10.97 5.78 5.20
Counties Manukau 6.58 2.40 4.20
Auckland 6.05 4.92 1.10
Taranaki 5.06 -3.89 9.00
Hawke’s Bay 0.84 2.75 -1.90
Manawatu -2.66 -10.32 7.70
Wellington -2.74 10.16 -12.90
Otago -3.98 -1.45 -2.50
Northland -4.42 -8.22 3.80
Waikato -5.74 -1.20 -4.50
Southland -6.31 -5.85 -0.50
Bay of Plenty -9.23 -5.47 -3.80
North Harbour -10.13 -9.77 -0.40


Performance So Far

So far there have been 70 matches played, 44 of which were correctly predicted, a success rate of 62.9%.

Here are the predictions for last week’s games.

Game Date Score Prediction Correct
1 Counties Manukau vs. Auckland Oct 08 41 – 18 1.40 TRUE
2 Waikato vs. Bay of Plenty Oct 09 29 – 12 5.70 TRUE
3 Otago vs. Manawatu Oct 10 25 – 38 5.40 FALSE
4 Wellington vs. North Harbour Oct 11 58 – 34 9.10 TRUE
5 Hawke’s Bay vs. Southland Oct 11 20 – 20 13.20 FALSE
6 Auckland vs. Northland Oct 11 38 – 10 13.60 TRUE
7 Taranaki vs. Canterbury Oct 12 23 – 26 -5.00 TRUE
8 Tasman vs. Counties Manukau Oct 12 16 – 21 12.40 FALSE


Predictions for the ITM Cup Finals

Here are the predictions for the ITM Cup Finals. The prediction is my estimated expected points difference with a positive margin being a win to the home team, and a negative margin a win to the away team.

Game Date Winner Prediction
1 Hawke’s Bay vs. Northland Oct 17 Hawke’s Bay 9.30
2 Manawatu vs. Southland Oct 18 Manawatu 7.70
3 Taranaki vs. Auckland Oct 18 Taranaki 3.00
4 Tasman vs. Canterbury Oct 18 Tasman 1.30


October 14, 2014

Does it make any more sense this time?

From the Herald today

“The average annual weekly wage increase of $28.06 was not enough to offset a $30,000 increase in the national median house price and an increase in the average mortgage interest rate from 5.52% to 5.86%,” the survey found.

We did this one last time, in June. Today’s story is better in that it links to the Massey report. It could still do with a bit of interpretation.

Quick, without a calculator, roughly what would be a large enough weekly wage increase to offset a $30,000 increase in the national median house price?  Would we need to up the $28.06 by ten percent, or  ten dollars, or a factor of ten?

[Update: I should also note that the word “weekly” wasn’t in the description of wage increases last time, so this is a definite improvement]

Ada Lovelace Day

October 14 is Ada Lovelace Day, an international celebration of the achievements of women in science, technology, engineering and maths.

New Zealand has (only) three female Professors of Statistics, the top position in our UK-style academic ranking. They work in very different areas of statistics, but with related applications to ecological and environmental monitoring, an area of particular interest in New Zealand.

Going north to south:

  • Marti Anderson is at Massey University in Albany (and was previously at the University of Auckland). Her research is in multivariate analysis — techniques for analysing ecological data on multiple species together, rather than one at a time — mostly applied to marine species
  • Shirley Pledger retired this year from Victoria University. Her research is on capture-recapture methods for counting animals. It’s often impossible to get a complete census of a species even in a limited area, but you can mark the individuals you catch, release them, and observe how often you catch them again. The simplest approaches to estimation are easy but unrealistic; she has worked on more sophisticated and sensible models.
  • Jennifer Brown is head of the Maths & Stats department at the University of Canterbury. Her main statistical research is on sampling techniques for monitoring sparse or patchy populations: either rare animals and plants, or invasive weeds. Sampling systematically or purely at random are both very wasteful; ‘adaptive’ sampling designs allow you to take advantage of finding a clump of your target species without biasing the overall results.


October 13, 2014

Context from everyday units

From @JohnDonoghue64 on Twitter

BzwlLlKIUAAGK2O

From the Guardian, a few years ago

Perhaps, as with metric and imperial measurements, such comparisons should be given convenient abbreviations: SoWs (size of Wales), SoBs (size of Belgium), OSPs (Olympic swimming pools), DDBs (buses) and so on. Thus the Kruger national park in South Africa measures 1 SoW (Daily Telegraph), as do Lesotho (London Evening Standard) and Israel (Times), whereas Lake Nzerakera in Tanzania is 2 SoBs (Observer).

At times the most carefully calibrated calculations can go awry. So we learn that Helmand province in Afghanistan is “four times the size of Wales” (Daily Telegraph, 2 December 2009) only to find a few weeks later that it has apparently shrunk to “the size of Wales” (Daily Telegraph, 29 January 2010).

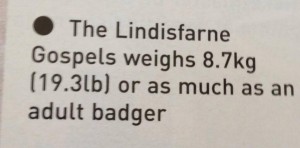
For the benefit of NZ readers, a badger appears to weigh about the same as three female North Island brown kiwi, two typical merino fleeces, or half a case of Malborough sav blanc. That should help you get a grasp on the size of the Lindisfarne Gospels.

Herald data blog starts

The Herald’s Data Editor, Harkanwal Singh,  announces the online site’s new ‘Data Blog’, with the first new post being a map of NZ internet affordability created by Jonathan Brewer.

This has got to be a Good Thing for data literacy in the local media.

Stat of the Week Winner: October 4 – 10 2014

Thanks for your nominations last week for our Stat of the Week competition!

This week, we’ve chosen the following to be our winner:

“‘Rates of participants brushing their teeth rose from 53 per cent to 73 per cent during the trial.’

This story got quite a bit of coverage, the stat actually relates to an increase in the number of people texting and saying they had brushed their teeth (far from the same thing).

The Herald got the context correct in their coverage:

This still seems to just be evidence that people will say anything when nagged enough.”

Congratulations Ben Moore!

Stat of the Week Competition: October 11 – 17 2014

Each week, we would like to invite readers of Stats Chat to submit nominations for our Stat of the Week competition and be in with the chance to win an iTunes voucher.

Here’s how it works:

  • Anyone may add a comment on this post to nominate their Stat of the Week candidate before midday Friday October 17 2014.
  • Statistics can be bad, exemplary or fascinating.
  • The statistic must be in the NZ media during the period of October 11 – 17 2014 inclusive.
  • Quote the statistic, when and where it was published and tell us why it should be our Stat of the Week.

Next Monday at midday we’ll announce the winner of this week’s Stat of the Week competition, and start a new one.

(more…)

Stat of the Week Competition Discussion: October 11 – 17 2014

If you’d like to comment on or debate any of this week’s Stat of the Week nominations, please do so below!

October 12, 2014

Unofficially over arithmetic

From the Herald (from the Washington Post), under the headline “Teens are officially over Facebook” (yes, officially)

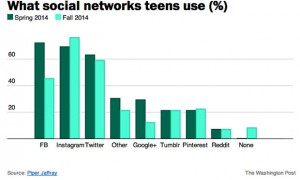
Now, a pretty dramatic new report out from Piper Jaffray – an investment bank with a sizable research arm – rules that the kids are over Facebook once and for all, having fled Mark Zuckerberg’s parent-flooded shores for the more forgiving embraces of Twitter and Instagram.

This is based on a survey by Piper Jaffray, of 7200 people aged 13-19, (in the US, though the Herald doesn’t say that).

It looks as though US teens are leaving Facebook, but they sure aren’t flocking to Twitter, or, really, to Instagram. If you go to a story that gives the numbers, you see that reported Facebook use has fallen 27 percentage points. Instagram has risen only 7 percentage points, and Twitter has fallen by 4.

 fb1

So, where are they going? They aren’t giving up on social media entirely — although “None” category wasn’t asked the first time around, it’s only 8 percent in the second survey.  It’s possible that teens are cutting down on the number of social media networks they use, but it seems more likely that the question was badly designed. Even I can think of at least one major site that isn’t on the list, Snapchat, which globalwebindex thinks is used by 42% of US internet-connected 16-19 year olds.

Incidentally: those little blue letters that look like they should be a link? They aren’t on the Herald site either, and on the Washington Post site they link to a message that basically says “no, not for you.”

October 10, 2014

Briefly

  • Something strange happened to this month’s unemployment data in Australia: Guardian, ABC News, interview with Rob Hyndman (who knows from time series)
  • “Ferguson’s 3,287 new registrants (in two months) is more than recorded by any township in St. Louis County in any midterm election since 2002.” Or not. A number that seems really extreme may just be wrong.
  • When there’s a lot of variation, it can be a mistake to make statements about “typical” attitudes: Andrew Gelman