Posts from August 2014 (52)

August 7, 2014

Non-bogus non-random polling

As you know, one of the public services StatsChat provides is whingeing about bogus polls in the media, at least when they are used to anchor stories rather than just being decorative widgets on the webpage. This attitude doesn’t (or doesn’t necessarily) apply to polls that make no effort to collect a non-random sample but do make serious efforts to reduce bias by modelling the data. Personally, I think it would be better to apply these modelling techniques on top of standard sampling approaches, but that might not be feasible. You can’t do everything.

I’ve been prompted to write this by seeing Andrew Gelman and David Rothschild’s reasonable and measured response (and also Andrew’s later reasonable and less measured response) to a statement from the American Association for Public Opinion Research.  The AAPOR said

This week, the New York Times and CBS News published a story using, in part, information from a non-probability, opt-in survey sparking concern among many in the polling community. In general, these methods have little grounding in theory and the results can vary widely based on the particular method used. While little information about the methodology accompanied the story, a high level overview of the methodology was posted subsequently on the polling vendor’s website. Unfortunately, due perhaps in part to the novelty of the approach used, many of the details required to honestly assess the methodology remain undisclosed.

As the responses make clear, the accusation about transparency of methods is unfounded. The accusation about theoretical grounding is the pot calling the kettle black.  Standard survey sampling theory is one of my areas of research. I’m currently writing the second edition of a textbook on it. I know about its grounding in theory.

The classical theory applies to most of my applied sampling work, which tends to involve sampling specimen tubes from freezers. The theoretical grounding does not apply when there is massive non-response, as in all political polling. It is an empirical observation based on election results that carefully-done quota samples and reweighted probability samples of telephones give pretty good estimates of public opinion. There is no mathematical guarantee.

Since classical approaches to opinion polling work despite massive non-response, it’s reasonable to expect that modelling-based approaches to non-probability data will also work, and reasonable to hope that they might even work better (given sufficient data and careful modelling). Whether they do work better is an empirical question, but these model-based approaches aren’t a flashy new fad. Rod Little, who pioneered the methods AAPOR is objecting to, did so nearly twenty years before his stint as Chief Scientist at the US Census Bureau, an institution not known for its obsession with the latest fashions.

In some settings modelling may not be feasible because of a lack of population data. In a few settings non-response is not a problem. Neither of those applies in US political polling. It’s disturbing when the president of one of the largest opinion-polling organisations argues that model-based approaches should not be referenced in the media, and that’s even before considering some of the disparaging language being used.

“Don’t try this at home” might have been a reasonable warning to pollers without access to someone like Andrew Gelman. “Don’t try this in the New York Times” wasn’t.
New breast cancer gene

The Herald has a pretty good story about a gene, PALB2, where there are mutations that cause a substantially raised risk of breast cancer.  It’s not as novel as the story implies (the first sentence of the abstract is “Germline loss-of-function mutations in PALB2 are known to confer a predisposition to breast cancer.”), but the quantified increase in risk is new and potentially a useful thing to know.

Genetic testing for BRCA mutations is funded in NZ for people with a sufficiently strong family history, but the policy is to test one of the affected relatives first. This new gene demonstrates why.

If you had a high-risk family history of breast cancer, and tested negative for BRCA1 and BRCA2 mutations, you might assume you had missed out on the bad gene. It’s possible, though, that your family’s risk was due to some other mutation — in PALB2, or in another undiscovered gene — and in that case the negative test didn’t actually tell you anything. By testing a family member  first, you can be sure you are looking in the right place for your risks, rather than just in the place that’s easiest to test.

August 6, 2014

With friends like these…

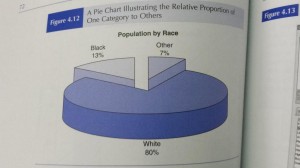
Via Alberto Cairo on Twitter, a picture from an introductory statistics text being sold at the big statistics conference in Boston this week

BuTiYZtIcAAaju0

Income statistics

The Herald has a story headlined “Where to work if it’s money you’re after,” giving estimated median incomes across a range of job areas.  Sadly, if you read to the end, two of the sources are summaries of advertised salaries for advertised jobs on Seek and TradeMe.  That is, they are neither actual incomes, nor for the country as a whole.

Rather than just whinge about unrepresentative data, I looked at StatsNZ. They divide things up differently, so there was only one job group in the story that exactly matched one on NZ.Stat. People working in construction have a median weekly income of $840 and mean weekly income of $956 according to the NZ Income Survey. If most people in construction worked all year, without periods of unemployment, this would come to a median annual income of  $43,680 or a mean of $49,712.

The Herald thinks the median annual income in construction is $60,000-$78,000.


NRL Predictions for Round 22

Team Ratings for Round 22

The basic method is described on my Department home page. I have made some changes to the methodology this year, including shrinking the ratings between seasons.

Here are the team ratings prior to this week’s games, along with the ratings at the start of the season.

Current Rating Rating at Season Start Difference
Rabbitohs 9.79 5.82 4.00
Sea Eagles 9.07 9.10 -0.00
Warriors 6.94 -0.72 7.70
Roosters 6.48 12.35 -5.90
Cowboys 5.45 6.01 -0.60
Storm 4.45 7.64 -3.20
Broncos 0.92 -4.69 5.60
Panthers 0.91 -2.48 3.40
Bulldogs -1.70 2.46 -4.20
Dragons -1.84 -7.57 5.70
Knights -3.61 5.23 -8.80
Titans -5.63 1.45 -7.10
Eels -6.41 -18.45 12.00
Wests Tigers -8.33 -11.26 2.90
Raiders -8.79 -8.99 0.20
Sharks -9.50 2.32 -11.80


Performance So Far

So far there have been 152 matches played, 85 of which were correctly predicted, a success rate of 55.9%.

Here are the predictions for last week’s games.

Game Date Score Prediction Correct
1 Sea Eagles vs. Broncos Aug 01 16 – 4 12.90 TRUE
2 Bulldogs vs. Panthers Aug 01 16 – 22 3.80 FALSE
3 Sharks vs. Eels Aug 02 12 – 32 5.90 FALSE
4 Cowboys vs. Titans Aug 02 28 – 8 14.50 TRUE
5 Roosters vs. Dragons Aug 02 30 – 22 14.00 TRUE
6 Raiders vs. Warriors Aug 03 18 – 54 -6.10 TRUE
7 Rabbitohs vs. Knights Aug 03 50 – 10 13.30 TRUE
8 Wests Tigers vs. Storm Aug 04 6 – 28 -5.20 TRUE


Predictions for Round 22

Here are the predictions for Round 22. The prediction is my estimated expected points difference with a positive margin being a win to the home team, and a negative margin a win to the away team.

Game Date Winner Prediction
1 Rabbitohs vs. Sea Eagles Aug 08 Rabbitohs 5.20
2 Broncos vs. Bulldogs Aug 08 Broncos 7.10
3 Cowboys vs. Wests Tigers Aug 09 Cowboys 18.30
4 Knights vs. Storm Aug 09 Storm -3.60
5 Eels vs. Raiders Aug 09 Eels 6.90
6 Warriors vs. Sharks Aug 10 Warriors 20.90
7 Dragons vs. Panthers Aug 10 Dragons 1.80
8 Roosters vs. Titans Aug 11 Roosters 16.60


Currie Cup Predictions for Round 1

Team Ratings for Round 1

The basic method is described on my Department home page. I have made some changes to the methodology this year, including shrinking the ratings between seasons.

Here are the team ratings prior to this week’s games, along with the ratings at the start of the season. Note that new teams are given a rating of -10. This is somewhat arbitrary, but has proved reasonably satisfactory in predicting Super Rugby games.

Current Rating Rating at Season Start Difference
Sharks 5.09 5.09 0.00
Western Province 3.43 3.43 -0.00
Cheetahs 0.33 0.33 0.00
Lions 0.07 0.07 0.00
Blue Bulls -0.74 -0.74 0.00
Griquas -7.49 -7.49 0.00
Kings -10.00 -10.00 0.00
Pumas -10.00 -10.00 0.00


Predictions for Round 1

Here are the predictions for Round 1. The prediction is my estimated expected points difference with a positive margin being a win to the home team, and a negative margin a win to the away team.

Game Date Winner Prediction
1 Kings vs. Western Province Aug 08 Western Province -8.40
2 Griquas vs. Sharks Aug 09 Sharks -7.60
3 Lions vs. Blue Bulls Aug 09 Lions 5.80
4 Pumas vs. Cheetahs Aug 09 Cheetahs -5.30


August 4, 2014

Predicting blood alcohol concentration is tricky

Rasmus Bååth, who is doing a PhD in Cognitive Science, in Sweden, has written a web app that predicts blood alcohol concentrations using reasonably sophisticated equations from the forensic science literature.

The web page gives a picture of the whole BAC curve over time, but requires a lot of detailed inputs. Some of these are things you could know accurately: your height and weight, exactly when you had each drink and what it was. Some of them you have a reasonable idea about: is your stomach empty or full, and therefore is alcohol absorption fast or slow. You also need to specify an alcohol elimination rate, which he says averages 0.018%/hour but could be half or twice that, and you have no real clue.

If you play around with the interactive controls, you can see why the advice given along with the new legal limits is so approximate (as Campbell Live is demonstrating tonight).  Rasmus has all sorts of disclaimers about how you shouldn’t rely on the app, so he’d probably be happier if you don’t do any more than that with it.

Stat of the Week Competition: August 2 – 8 2014

Each week, we would like to invite readers of Stats Chat to submit nominations for our Stat of the Week competition and be in with the chance to win an iTunes voucher.

Here’s how it works:

  • Anyone may add a comment on this post to nominate their Stat of the Week candidate before midday Friday August 8 2014.
  • Statistics can be bad, exemplary or fascinating.
  • The statistic must be in the NZ media during the period of August 2 – 8 2014 inclusive.
  • Quote the statistic, when and where it was published and tell us why it should be our Stat of the Week.

Next Monday at midday we’ll announce the winner of this week’s Stat of the Week competition, and start a new one.

(more…)

Stat of the Week Competition Discussion: August 2 – 8 2014

If you’d like to comment on or debate any of this week’s Stat of the Week nominations, please do so below!

August 2, 2014

When in doubt, randomise

The Cochrane Collaboration, the massive global conspiracy to summarise and make available the results of clinical trials, has developed ‘Plain Language Summaries‘ to make the results easier to understand (they hope).

There’s nothing terribly noticeable about a plain-language initiative; they happen all the time.  What is unusual is that the Cochrane Collaboration tested the plain-language summaries in a randomised comparison to the old format. The abstract of their research paper (not, alas, itself a plain-language summary) says

With the new PLS, more participants understood the benefits and harms and quality of evidence (53% vs. 18%, P < 0.001); more answered each of the five questions correctly (P ≤ 0.001 for four questions); and they answered more questions correctly, median 3 (interquartile range [IQR]: 1–4) vs. 1 (IQR: 0–1), P < 0.001). Better understanding was independent of education level. More participants found information in the new PLS reliable, easy to find, easy to understand, and presented in a way that helped make decisions. Overall, participants preferred the new PLS.

That is, it worked. More importantly, they know it worked.