Posts from August 2014 (52)

August 13, 2014

Most things don’t work

A nice story in the Herald about a randomised trial of hand sanitiser dispensers in schools.

The study, published today in the journal PLoS Medicine, found absence rates at schools that installed dispensers in classrooms as part of the survey were similar at those “control” schools which did not.

There’s even a good description of the right way to do sample size calculations for a clinical trial

Beforehand, the authors believed a 20 per cent reduction in absences due to illness would be important enough to merit schools considering making hand sanitiser available, so designed the study to detect such a difference.

“Some previous studies suggested that there could be a bigger effect than that, but we wanted to be sure of detecting an effect of that size if it was there,” Dr Priest told the Herald.

That is, the study not only failed to find a benefit, it ruled out any worthwhile benefit. Either Kiwi kids are already washing their hands enough, or they didn’t use the supplied sanitiser.

My only quibble is that the story didn’t link to the open-access research paper.
 

NRL Predictions for Round 23

Team Ratings for Round 23

The basic method is described on my Department home page. I have made some changes to the methodology this year, including shrinking the ratings between seasons.

Here are the team ratings prior to this week’s games, along with the ratings at the start of the season.

Current Rating Rating at Season Start Difference
Rabbitohs 11.06 5.82 5.20
Cowboys 8.75 6.01 2.70
Sea Eagles 7.80 9.10 -1.30
Roosters 5.65 12.35 -6.70
Warriors 5.40 -0.72 6.10
Storm 3.89 7.64 -3.70
Broncos 3.00 -4.69 7.70
Panthers 2.18 -2.48 4.70
Knights -3.05 5.23 -8.30
Dragons -3.11 -7.57 4.50
Bulldogs -3.78 2.46 -6.20
Titans -4.79 1.45 -6.20
Eels -6.28 -18.45 12.20
Sharks -7.97 2.32 -10.30
Raiders -8.92 -8.99 0.10
Wests Tigers -11.62 -11.26 -0.40


Performance So Far

So far there have been 160 matches played, 91 of which were correctly predicted, a success rate of 56.9%.

Here are the predictions for last week’s games.

Game Date Score Prediction Correct
1 Rabbitohs vs. Sea Eagles Aug 08 23 – 4 5.20 TRUE
2 Broncos vs. Bulldogs Aug 08 41 – 10 7.10 TRUE
3 Cowboys vs. Wests Tigers Aug 09 64 – 6 18.30 TRUE
4 Knights vs. Storm Aug 09 32 – 30 -3.60 FALSE
5 Eels vs. Raiders Aug 09 18 – 10 6.90 TRUE
6 Warriors vs. Sharks Aug 10 16 – 12 20.90 TRUE
7 Dragons vs. Panthers Aug 10 4 – 16 1.80 FALSE
8 Roosters vs. Titans Aug 11 26 – 18 16.60 TRUE


Predictions for Round 23

Here are the predictions for Round 23. The prediction is my estimated expected points difference with a positive margin being a win to the home team, and a negative margin a win to the away team.

Game Date Winner Prediction
1 Rabbitohs vs. Broncos Aug 14 Rabbitohs 12.60
2 Eels vs. Bulldogs Aug 15 Eels 2.00
3 Raiders vs. Dragons Aug 16 Dragons -1.30
4 Storm vs. Sharks Aug 16 Storm 16.40
5 Wests Tigers vs. Roosters Aug 16 Roosters -12.80
6 Knights vs. Warriors Aug 17 Warriors -4.00
7 Titans vs. Sea Eagles Aug 17 Sea Eagles -8.10
8 Panthers vs. Cowboys Aug 18 Cowboys -2.10


ITM Cup Predictions for Round 1

Team Ratings for Round 1

Here are the team ratings prior to Round 1, along with the ratings at the start of the season. I have created a brief description of the method I use for predicting rugby games. Go to my Department home page to see this.

Here are the team ratings prior to this week’s games, along with the ratings at the start of the season.

Current Rating Rating at Season Start Difference
Canterbury 18.09 18.09 0.00
Wellington 10.16 10.16 0.00
Tasman 5.78 5.78 0.00
Auckland 4.92 4.92 0.00
Hawke’s Bay 2.75 2.75 0.00
Counties Manukau 2.40 2.40 0.00
Waikato -1.20 -1.20 0.00
Otago -1.45 -1.45 0.00
Taranaki -3.89 -3.89 0.00
Bay of Plenty -5.47 -5.47 0.00
Southland -5.85 -5.85 0.00
Northland -8.22 -8.22 0.00
North Harbour -9.77 -9.77 0.00
Manawatu -10.32 -10.32 0.00


Predictions for Round 1

Here are the predictions for Round 1. The prediction is my estimated expected points difference with a positive margin being a win to the home team, and a negative margin a win to the away team.

Game Date Winner Prediction
1 Taranaki vs. Counties Manukau Aug 14 Counties Manukau -2.30
2 Southland vs. Bay of Plenty Aug 15 Southland 3.60
3 Otago vs. North Harbour Aug 16 Otago 12.30
4 Canterbury vs. Auckland Aug 16 Canterbury 17.20
5 Wellington vs. Waikato Aug 16 Wellington 15.40
6 Tasman vs. Hawke’s Bay Aug 17 Tasman 7.00
7 Northland vs. Manawatu Aug 17 Northland 6.10


Currie Cup Predictions for Round 2

Team Ratings for Round 2

The basic method is described on my Department home page. I have made some changes to the methodology this year, including shrinking the ratings between seasons.

Here are the team ratings prior to this week’s games, along with the ratings at the start of the season.

Current Rating Rating at Season Start Difference
Sharks 5.04 5.09 -0.00
Western Province 4.10 3.43 0.70
Lions 1.37 0.07 1.30
Cheetahs -0.44 0.33 -0.80
Blue Bulls -2.04 -0.74 -1.30
Griquas -7.45 -7.49 0.00
Pumas -9.23 -10.00 0.80
Kings -10.67 -10.00 -0.70


Performance So Far

So far there have been 4 matches played, 3 of which were correctly predicted, a success rate of 75%.

Here are the predictions for last week’s games.

Game Date Score Prediction Correct
1 Kings vs. Western Province Aug 08 16 – 35 -8.40 TRUE
2 Griquas vs. Sharks Aug 09 24 – 31 -7.60 TRUE
3 Lions vs. Blue Bulls Aug 09 41 – 13 5.80 TRUE
4 Pumas vs. Cheetahs Aug 09 28 – 21 -5.30 FALSE


Predictions for Round 2

Here are the predictions for Round 2. The prediction is my estimated expected points difference with a positive margin being a win to the home team, and a negative margin a win to the away team.

Game Date Winner Prediction
1 Sharks vs. Pumas Aug 15 Sharks 19.30
2 Western Province vs. Blue Bulls Aug 16 Western Province 11.10
3 Lions vs. Kings Aug 16 Lions 17.00
4 Cheetahs vs. Griquas Aug 16 Cheetahs 12.00


When are self-selected samples worth discussing?

From recent weeks, three examples of claims from self-selected samples:

In all three cases, you’d expect the pattern to generalise to some extent, but not quantitatively. The dating site in question specifically boasts about the non-representativeness of its members; the NZAS survey was sent to people who’d be likely to care, and there wasn’t much time to respond; scientists who had experienced or witnessed harassment would be more likely to respond and to pass the survey along to others.

I think two of these are worth presenting and discussing, and the other one isn’t, and that’s not just because two of them agree with my political prejudices.

The key question to ask when looking at this sort of probably non-representative sample, is whether the response you see would still be interesting if no-one outside the sample shared it. That is, the surveys tell us at a minimum

  • there exist 350 women in New Zealand who wouldn’t marry a man earning less than them, and are prepared to say so
  • there exist 200-odd scientists in NZ who think the National Science Challenges were badly chosen or conducted, and are prepared to say so
  • there exist 417 scientists who have experienced verbal sexual harassment, and 139 who have experienced unwanted physical contact from other research staff during fieldwork, and are prepared to say so.

I would argue that the first of these is completely uninteresting, but the second is contrary to the impressions being given by the government, and the third should worry scientists who participate in or organise fieldwork.


August 11, 2014

Stat of the Week Competition: August 9 – 15 2014

Each week, we would like to invite readers of Stats Chat to submit nominations for our Stat of the Week competition and be in with the chance to win an iTunes voucher.

Here’s how it works:

  • Anyone may add a comment on this post to nominate their Stat of the Week candidate before midday Friday August 15 2014.
  • Statistics can be bad, exemplary or fascinating.
  • The statistic must be in the NZ media during the period of August 9 – 15 2014 inclusive.
  • Quote the statistic, when and where it was published and tell us why it should be our Stat of the Week.

Next Monday at midday we’ll announce the winner of this week’s Stat of the Week competition, and start a new one.

(more…)

Stat of the Week Competition Discussion: August 9 – 15 2014

If you’d like to comment on or debate any of this week’s Stat of the Week nominations, please do so below!

August 9, 2014

Briefly

Limits of measurement edition

  • “So you can either believe that Germany has no billionaires or that European statisticians aren’t very good at finding them.” Stories from Slate and Bloomberg on the difficulty of estimating wealth inequality
  • “Big data really only has one unalloyed success on its track record, and it’s an old one: Google, specifically its Web search.” Another story from Slate, on Big Data and creepy experiments.
  • Even for the best drink-driving propaganda, such as the famous ‘Ghost Chips’ ad, the evaluation is basically in terms of public perception, because it’s too hard to evaluate actual impact on drink driving.  A nice piece from TheWireless
August 8, 2014

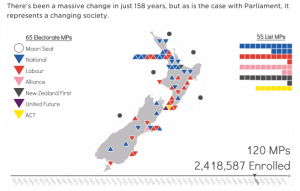
History of NZ Parliament visualisation

One frame of a video showing NZ party representation in Parliament over time,

nzparties

made by Stella Blake-Kelly for TheWireless. Watch (and read) the whole thing.

August 7, 2014

Vitamin D context

There’s a story in the Herald about Alzheimer’s Disease risk being much higher in people with low vitamin D levels in their blood. This is observational data, where vitamin D was measured and the researchers then waited to see who would get dementia. That’s all in the story, and the problems aren’t the Herald’s fault.

The lead author of the research paper is quoted as saying

“Clinical trials are now needed to establish whether eating foods such as oily fish or taking vitamin D supplements can delay or even prevent the onset of Alzheimer’s disease and dementia.”

That’s true, as far as it goes, but you might have expected the person writing the press release to mention the existing randomised trial evidence.

The Women’s Health Initiative, one of the largest and probably the most expensive randomised trial ever, included randomisation to calcium and vitamin D or placebo. The goal was to look at prevention of fractures, with prevention of colon cancer as a secondary question, but they have data on dementia and they have published it

During a mean follow-up of 7.8 years, 39 participants in the treatment group and 37 in the placebo group developed incident dementia (hazard ratio (HR) = 1.11, 95% confidence interval (CI) = 0.71-1.74, P = .64). Likewise, 98 treatment participants and 108 placebo participants developed incident [mild cognitive impairment] (HR = 0.95, 95% CI = 0.72-1.25, P = .72). There were no significant differences in incident dementia or [mild cognitive impairment] or in global or domain-specific cognitive function between groups.

That’s based on roughly 2000 women in each treatment group.

The Women’s Health Initiative data doesn’t nail down all the possibilities. It could be that a higher dose is needed. It could be that the women were too healthy (although half of them had low vitamin D levels by usual criteria). The research paper mentions the Women’s Health Initiative and these possible explanations, so the authors were definitely aware of them.

If you’re going to tell people about a potential way to prevent dementia, it would be helpful to at least mention that one form of it has been tried and didn’t work.