Posts from August 2014 (52)

August 25, 2014

Stat of the Week Competition: August 23 – 29 2014

Each week, we would like to invite readers of Stats Chat to submit nominations for our Stat of the Week competition and be in with the chance to win an iTunes voucher.

Here’s how it works:

  • Anyone may add a comment on this post to nominate their Stat of the Week candidate before midday Friday August 29 2014.
  • Statistics can be bad, exemplary or fascinating.
  • The statistic must be in the NZ media during the period of August 23 – 29 2014 inclusive.
  • Quote the statistic, when and where it was published and tell us why it should be our Stat of the Week.

Next Monday at midday we’ll announce the winner of this week’s Stat of the Week competition, and start a new one.

(more…)

Stat of the Week Competition Discussion: August 23 – 29 2014

If you’d like to comment on or debate any of this week’s Stat of the Week nominations, please do so below!

August 22, 2014

Margin of error for minor parties

The 3% ‘margin of error’ usually quoted for poll is actually the ‘maximum margin of error’, and is an overestimate for minor parties. On the other hand, it also assumes simple random sampling and so tends to be an underestimate for major parties.

In case anyone is interested, I have done the calculations for a range of percentages (code here), both under simple random sampling and under one assumption about real sampling.


Lower and upper ‘margin of error’ limits for a sample of size 1000 and the observed percentage, under the usual assumptions of independent sampling

Percentage lower upper
1 0.5 1.8
2 1.2 3.1
3 2.0 4.3
4 2.9 5.4
5 3.7 6.5
6 4.6 7.7
7 5.5 8.8
8 6.4 9.9
9 7.3 10.9
10 8.2 12.0
15 12.8 17.4
20 17.6 22.6
30 27.2 32.9
50 46.9 53.1


Lower and upper ‘margin of error’ limits for a sample of size 1000 and the observed percentage, assuming that complications in sampling inflate the variance by a factor of 2, which empirically is about right for National.

Percentage lower upper
1 0.3 2.3
2 1.0 3.6
3 1.7 4.9
4 2.5 6.1
5 3.3 7.3
6 4.1 8.5
7 4.9 9.6
8 5.8 10.7
9 6.6 11.9
10 7.5 13.0
15 12.0 18.4
20 16.6 23.8
30 26.0 34.2
50 45.5 54.5

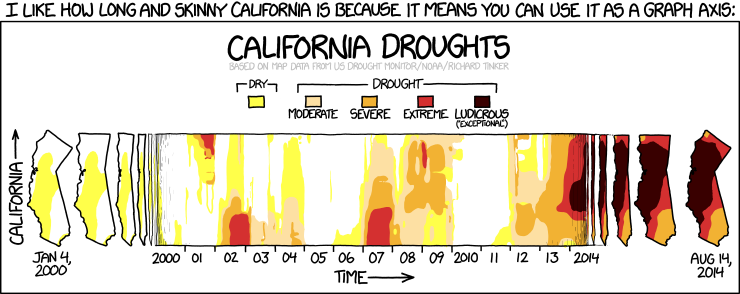
California drought visualisation


From XKCD. Both the data and the display technique are worth looking at

california


Presumably you could do something similar with New Zealand, which is roughly the same shape.

August 21, 2014

Auckland rates arithmetic

In today’s Herald story about increases in rates and impact on renters it’s not that the numbers are wrong, it’s that they haven’t been subjected to the right sorts of basic arithmetic.

The lead is

Auckland landlords are hiking rents amid fears of big rates increases next year on the back of spiralling property values.

and later on

Increases in landlords’ expenses, including rates, mortgage interest rates and insurance premiums, could push up rent on a three-bedroom Auckland house by between $20 and $40 a week, he said.

Including‘ is doing a lot of work in that sentence. The implications are particularly unfortunate in a story targeted at renters, who don’t get sent rates information directly and are less likely to know the details of  the system.

The first place to start is with a rough estimate of how much money we’re looking at. One of the few useful things the Taxpayers’ Union has done is to collate data on rates, hosted now at Stuff. The average Auckland rates bill was $2636.  That’s all residences, not three-bedroom houses, but the order of magnitude should be right. An annual bill of $2636 is $50/week. If the average total weekly rates payment is around $50, the average increase can’t reasonably be a big fraction of $20-$40/week or there’d be a lot more rioting in the streets.

Anyone who owns a house in Auckland or checks the Council website should know there is a cap on rates increases to cover the neighbourhoods where prices are increasing fastest. The cap is 10%/year; no rates increase faster than that, and most increase slower.  To get more detailed information you’d need to look at the website describing 2014/2015 rates changes, and find that the average increase for residential properties is 3.7%, then calculate that 3.7% of $50/week is about $2/week.

According to the Reserve Bank, both floating and two-year-fixed mortgage interest rates have gone up 0.5% since last year.  That’s $9.60/week per $100,000 of mortgage, so it’s likely to be a much bigger component of the rental cost increase than the rates are.

The average increase in rates is a lot slower than the increase in property prices (10% in the year to July), but you’d expect it to be. The council doesn’t set a fixed percentage of value from year to year and live with real-estate price fluctuations. It sets a budget for total rates income, and then distributes the cost using a combination of a fixed charge and a proportion of value. In other words, the increase in average real-estate prices in Auckland has no direct impact on average increase in rates — it’s just that if your house value has gone up more than average, your rates will tend to go up more than average.   Increases in average real-estate price obviously do lead to increases in rental price, but rates are not the mechanism.

The Council is currently working on a ten-year plan, including the total rates income over that period of time. It will be open for public comment in January.
 

August 20, 2014

NRL Predictions for Round 24

Team Ratings for Round 24

The basic method is described on my Department home page. I have made some changes to the methodology this year, including shrinking the ratings between seasons.

Here are the team ratings prior to this week’s games, along with the ratings at the start of the season.

Current Rating Rating at Season Start Difference
Rabbitohs 12.31 5.82 6.50
Cowboys 8.42 6.01 2.40
Roosters 8.31 12.35 -4.00
Sea Eagles 7.28 9.10 -1.80
Storm 6.12 7.64 -1.50
Warriors 4.45 -0.72 5.20
Panthers 2.51 -2.48 5.00
Broncos 1.76 -4.69 6.40
Dragons -1.60 -7.57 6.00
Knights -2.10 5.23 -7.30
Bulldogs -3.37 2.46 -5.80
Titans -4.27 1.45 -5.70
Eels -6.70 -18.45 11.80
Sharks -10.20 2.32 -12.50
Raiders -10.43 -8.99 -1.40
Wests Tigers -14.28 -11.26 -3.00


Performance So Far

So far there have been 168 matches played, 96 of which were correctly predicted, a success rate of 57.1%.

Here are the predictions for last week’s games.

Game Date Score Prediction Correct
1 Rabbitohs vs. Broncos Aug 14 42 – 16 12.60 TRUE
2 Eels vs. Bulldogs Aug 15 16 – 18 2.00 FALSE
3 Raiders vs. Dragons Aug 16 16 – 34 -1.30 TRUE
4 Storm vs. Sharks Aug 16 48 – 6 16.40 TRUE
5 Wests Tigers vs. Roosters Aug 16 4 – 48 -12.80 TRUE
6 Knights vs. Warriors Aug 17 28 – 22 -4.00 FALSE
7 Titans vs. Sea Eagles Aug 17 12 – 15 -8.10 TRUE
8 Panthers vs. Cowboys Aug 18 23 – 22 -2.10 FALSE


Predictions for Round 24

Here are the predictions for Round 24. The prediction is my estimated expected points difference with a positive margin being a win to the home team, and a negative margin a win to the away team.

Game Date Winner Prediction
1 Bulldogs vs. Wests Tigers Aug 21 Bulldogs 15.40
2 Eels vs. Sea Eagles Aug 22 Sea Eagles -9.50
3 Broncos vs. Knights Aug 23 Broncos 8.40
4 Rabbitohs vs. Cowboys Aug 23 Rabbitohs 8.40
5 Warriors vs. Roosters Aug 24 Warriors 0.60
6 Sharks vs. Raiders Aug 24 Sharks 4.70
7 Dragons vs. Titans Aug 24 Dragons 7.20
8 Panthers vs. Storm Aug 25 Panthers 0.90


ITM Cup Predictions for Round 2

Team Ratings for Round 2

Here are the team ratings prior to Round 2, along with the ratings at the start of the season. I have created a brief description of the method I use for predicting rugby games. Go to my Department home page to see this.

Here are the team ratings prior to this week’s games, along with the ratings at the start of the season.

Current Rating Rating at Season Start Difference
Canterbury 19.69 18.09 1.60
Wellington 8.20 10.16 -2.00
Tasman 6.79 5.78 1.00
Auckland 3.31 4.92 -1.60
Counties Manukau 2.19 2.40 -0.20
Hawke’s Bay 1.75 2.75 -1.00
Waikato 0.77 -1.20 2.00
Otago -1.29 -1.45 0.20
Taranaki -3.68 -3.89 0.20
Southland -5.25 -5.85 0.60
Bay of Plenty -6.08 -5.47 -0.60
Northland -9.09 -8.22 -0.90
Manawatu -9.45 -10.32 0.90
North Harbour -9.93 -9.77 -0.20


Performance So Far

So far there have been 7 matches played, 4 of which were correctly predicted, a success rate of 57.1%.

Here are the predictions for last week’s games.

Game Date Score Prediction Correct
1 Taranaki vs. Counties Manukau Aug 14 9 – 9 -2.30 FALSE
2 Southland vs. Bay of Plenty Aug 15 34 – 23 3.60 TRUE
3 Otago vs. North Harbour Aug 16 28 – 14 12.30 TRUE
4 Canterbury vs. Auckland Aug 16 48 – 9 17.20 TRUE
5 Wellington vs. Waikato Aug 16 25 – 37 15.40 FALSE
6 Tasman vs. Hawke’s Bay Aug 17 35 – 15 7.00 TRUE
7 Northland vs. Manawatu Aug 17 23 – 28 6.10 FALSE


Predictions for Round 2

Here are the predictions for Round 2. The prediction is my estimated expected points difference with a positive margin being a win to the home team, and a negative margin a win to the away team.

Game Date Winner Prediction
1 North Harbour vs. Southland Aug 21 Southland -0.70
2 Waikato vs. Canterbury Aug 22 Canterbury -14.90
3 Hawke’s Bay vs. Taranaki Aug 22 Hawke’s Bay 9.40
4 Northland vs. Wellington Aug 23 Wellington -13.30
5 Counties Manukau vs. Otago Aug 23 Counties Manukau 7.50
6 Manawatu vs. Auckland Aug 24 Auckland -8.80
7 Bay of Plenty vs. Tasman Aug 24 Tasman -8.90


Currie Cup Predictions for Round 3

Team Ratings for Round 3

The basic method is described on my Department home page. I have made some changes to the methodology this year, including shrinking the ratings between seasons.

Here are the team ratings prior to this week’s games, along with the ratings at the start of the season.

Current Rating Rating at Season Start Difference
Western Province 4.90 3.43 1.50
Sharks 4.87 5.09 -0.20
Lions 2.77 0.07 2.70
Cheetahs -0.78 0.33 -1.10
Blue Bulls -2.84 -0.74 -2.10
Griquas -7.10 -7.49 0.40
Pumas -9.07 -10.00 0.90
Kings -12.06 -10.00 -2.10


Performance So Far

So far there have been 8 matches played, 7 of which were correctly predicted, a success rate of 87.5%.

Here are the predictions for last week’s games.

Game Date Score Prediction Correct
1 Sharks vs. Pumas Aug 15 34 – 17 19.30 TRUE
2 Western Province vs. Blue Bulls Aug 16 41 – 17 11.10 TRUE
3 Lions vs. Kings Aug 16 60 – 19 17.00 TRUE
4 Cheetahs vs. Griquas Aug 16 34 – 27 12.00 TRUE


Predictions for Round 3

Here are the predictions for Round 3. The prediction is my estimated expected points difference with a positive margin being a win to the home team, and a negative margin a win to the away team.

Game Date Winner Prediction
1 Pumas vs. Griquas Aug 22 Pumas 3.00
2 Blue Bulls vs. Kings Aug 23 Blue Bulls 14.20
3 Western Province vs. Lions Aug 23 Western Province 7.10
4 Sharks vs. Cheetahs Aug 23 Sharks 10.60


Good neighbours make good fences

Two examples of neighbourly correlations, at least one of which is not causation

1. A (good) Herald story today, about research in Michigan that found people who got on well with their neighbours were less likely to have heart attacks

2. An old Ministry of Justice report showing people who told their neighbours whenever they went away were much less likely to get burgled.

The burglary story is the one we know is mostly not causal.  People who tell their neighbours whenever they go on holiday were about half as likely to have experienced a burglary, but only about one burglary in seven happened while the residents were on holiday. There must be something else about types of neighbourhoods or relationships with neighbours that explains most of the correlation.

I’m pretty confident the heart-disease story works the same way.  The researchers had some possible explanations

The mechanism behind the association was not known, but the team said neighbourly cohesion could encourage physical activities such as walking, which counter artery clogging and disease.

That could be true, but is it really more likely that talking to your neighbours makes you walk around the neighbourhood or work in the garden, or that walking around the neighbourhood and working in the garden leads to talking to your neighbours? On top of that, the correlation with neighbourly cohesion was rather stronger then the correlation previously observed with walking.

August 19, 2014

Fortune cookie endings

Or, often in NZ papers, “… in the UK”.

There’s a Herald story with the lead

More than 12,000 new cases of cancer every year can be attributed to the patient being overweight or obese, the biggest ever study of the links between body mass index and cancer has revealed.

Since there about about 20,000 new cases of cancer a year in NZ, that would be quite a lot.  The story never actually comes out and says the 12,000 is for the UK, but it is, and if you read the whole thing it becomes fairly clear.  It still seems the sort of context that a reader might find helpful.