Posts from July 2014 (54)

July 17, 2014

Super 15 Predictions for the Qualifying Finals

Team Ratings for the Qualifying Finals

The basic method is described on my Department home page. I have made some changes to the methodology this year, including shrinking the ratings between seasons.

Here are the team ratings prior to this week’s games, along with the ratings at the start of the season.

Current Rating Rating at Season Start Difference
Waratahs 9.66 1.67 8.00
Crusaders 8.78 8.80 -0.00
Sharks 5.92 4.57 1.40
Brumbies 2.97 4.12 -1.10
Hurricanes 2.89 -1.44 4.30
Bulls 2.88 4.87 -2.00
Chiefs 2.02 4.38 -2.40
Stormers 1.68 4.38 -2.70
Blues 1.44 -1.92 3.40
Highlanders -3.12 -4.48 1.40
Lions -3.39 -6.93 3.50
Force -4.67 -5.37 0.70
Reds -4.98 0.58 -5.60
Cheetahs -5.55 0.12 -5.70
Rebels -9.53 -6.36 -3.20


Performance So Far

So far there have been 120 matches played, 78 of which were correctly predicted, a success rate of 65%.

Here are the predictions for last week’s games.

Game Date Score Prediction Correct
1 Blues vs. Chiefs Jul 11 8 – 11 2.70 FALSE
2 Brumbies vs. Force Jul 11 47 – 25 8.50 TRUE
3 Bulls vs. Rebels Jul 11 40 – 7 14.20 TRUE
4 Crusaders vs. Highlanders Jul 12 34 – 8 12.80 TRUE
5 Reds vs. Waratahs Jul 12 3 – 34 -9.60 TRUE
6 Lions vs. Cheetahs Jul 12 60 – 25 0.80 TRUE
7 Stormers vs. Sharks Jul 12 10 – 29 0.60 FALSE


Predictions for the Qualifying Finals

Here are the predictions for the Qualifying Finals. The prediction is my estimated expected points difference with a positive margin being a win to the home team, and a negative margin a win to the away team.

Game Date Winner Prediction
1 Brumbies vs. Chiefs Jul 19 Brumbies 5.00
2 Sharks vs. Highlanders Jul 19 Sharks 13.00


July 14, 2014

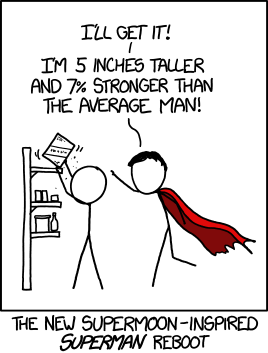
Supermoon

Why supermoons aren’t a big deal for earthquakes, based on XKCD

superm_n

Multiple testing, evidence, and football

There’s a Twitter account, @FifNdhs, that has five tweets, posted well before today’s game

  • Prove FIFA is corrupt
  • Tomorrow’s scoreline will be Germany win 1-0
  • Germany will win at ET
  • Gotze will score
  • There will be a goal in the second half of ET

What’s the chance of getting these four predictions right, if the game isn’t rigged?

Pretty good, actually. None of these events is improbable on its own, and  Twitter lets you delete tweets and delete accounts. If you set up several accounts, posted a few dozen tweets on each, describing plausible events, and then deleted the unsuccessful ones, you could easily come up with an implausible-sounding remainder.

Twitter can prove you made a prediction, but it can’t prove you didn’t also make a different one, so it’s only good evidence of a prediction if either the predictions were widely retweeted before they happened, or the event described in a single tweet is massively improbable.

If @FifNdhs had predicted a 7-1 victory for Germany over Brazil in the semifinal, that would have been worth paying attention to. Gotze scoring, not so much.

Stat of the Week Competition: July 12 – 18 2014

Each week, we would like to invite readers of Stats Chat to submit nominations for our Stat of the Week competition and be in with the chance to win an iTunes voucher.

Here’s how it works:

  • Anyone may add a comment on this post to nominate their Stat of the Week candidate before midday Friday July 18 2014.
  • Statistics can be bad, exemplary or fascinating.
  • The statistic must be in the NZ media during the period of July 12 – 18 2014 inclusive.
  • Quote the statistic, when and where it was published and tell us why it should be our Stat of the Week.

Next Monday at midday we’ll announce the winner of this week’s Stat of the Week competition, and start a new one.

(more…)

Stat of the Week Competition Discussion: July 12 – 18 2014

If you’d like to comment on or debate any of this week’s Stat of the Week nominations, please do so below!

July 13, 2014

Age/period/cohort voting

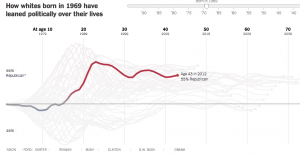
From the New York Times, an interactive graph showing how political leanings at different ages have changed over time

vote

Yes, voting preferences for kids are problematic. Read the story (and this link) to find out how they inferred them. There’s more at Andrew Gelman’s blog.

100% accurate medical testing

The Wireless has a story about a fatal disease where there’s an essentially 100% accurate test available.

Alice Harbourne has a 50% chance of Huntington’s Disease. If she gets tested, she will have either a 0% or 100% chance, and despite some recent progress on the mechanism of the disease, there is no treatment.

July 11, 2014

Another prostate cancer study

Today’s prostate cancer risk factor, per the Herald, is vasectomy. The press release is here; the paper isn’t open-access.

This is a much more reliable study than the one earlier in the week about cycling, and there’s reasonable case that this one is worth a press release.

In 1986, the researchers recruited about 50000 men (health professionals: mostly dentists and vets), then followed them up to see how their health changed over time.  This research involves the 43000 who hadn’t had any sort of cancer at the start of the study. As the Herald says, about a quarter of the men had a vasectomy, and there have been 6000 prostate cancer diagnoses. So there’s a reasonable sample size, and there is a good chance you would have heard about this result if no difference had been found (though probably not via the Daily Mail)

The relative increase in risk is estimated as about 10% overall and about 20% for ‘high-grade’ tumours, which is much more plausible than the five-fold increase claimed for cycling.  The researchers had information about the number of prostate cancer tests the men had had, so they can say this isn’t explained by a difference in screening — the cycling study only had total number of doctor visits in the past year. Also, the 20% difference is seen in prostate cancer deaths, not just in diagnoses, though if you only consider deaths the evidence is borderline.  Despite all this, the researchers quite rightly don’t claim the result is conclusive.

There are two things the story doesn’t say. First, if you Google the name of the lead researcher and ‘prostate cancer’, one of the top hits is another paper on prostate cancer (and coffee, protective). That is, the Health Professionals Followup Study, like its sister cohort, the Nurses Health Study, is in the business of looking for correlations between a long list of interesting exposures and potential effects. Some of what it finds will be noise, even if it appears to pass sanity checks and statistical filters. They aren’t doing anything wrong, that’s just what life is like.

Second, there were 167 lethal prostate cancers in men with vasectomies. If the excess risk of 20% is really due to vasectomy, rather than something else, that would mean about 27 cancers caused by 12000 vasectomies. Combining lethal and advanced cases, the same approach gives an estimated 38 cases from 12000 vasectomies. So, if this is causation, the risk is 2 or 3 serious prostate cancers for every 1000 vasectomies. That’s not trivial, but I think it sounds smaller than “20% raised risk”.

July 10, 2014

Summaries of income

I don’t want to get into the general business of election fact-checking, but we have a Stat-of-the-Week  nomination for a statement that is (a) about a specifically statistical issue at the high-school level, and (b) unambiguously wrong.  From Richard Prebble’s “The Letter”:

 Cunliffe is basing Labour’s election campaign around the claim that inequality is growing. Fact check: inequality is falling and New Zealand remains a very equal country. The claim that around a quarter of a million children are in poverty is dubious, to say the very least. Cunliffe says households in poverty have less than 60 percent of the medium income after housing costs. If Bill Gates came to live in New Zealand, the medium income of the country would rise and, according to that logic, more children would be in poverty.

David Cunliffe, as you presumably know, talked about the median, not “medium”; the use of a fraction of median income as a relative poverty threshold is very common internationally. The reason for using the median is precisely that the median income of the country would not rise if a few billionaires were added to the population. The median, the income of the household in the middle of the income distribution, is very insensitive to changes in or additions of a few values. That’s what it’s for.

While I’m writing, I might as well mention the inequality statistics.  Mr Cunliffe isn’t making up his figures on children in poverty; they can be found in the 2014 Household Incomes Report from the Ministry of Social Development [update: that figure is 260000, which matches what The Letter reported was said, but the actual speech said 285000]. The report also gives trends in the Gini index of inequality and in the proportion of income spent on housing.  StatsNZ gives trends in the ratio of 80th to 20th percentile of income, before and after housing costs. The details of trends in inequality depend on how you measure it, but by these measures it is neither falling, nor notably low internationally.

July 9, 2014

Would I have heard if the results were different?

The story about cycling and prostate cancer in the Herald (or the Daily Mail) is a good opportunity to look at some of the rules of thumb for deciding which stories to read or believe:

Firstly, would you have heard if the results were the other way around? Almost certainly not: prostate cancer wasn’t the main point of this study, and there wasn’t a previously-suspected relationship.

Second, for cancer specifically, is this mortality or diagnosis data? That is, are we seeing an increase in detection or in cancer? This is diagnosis data; so it could be just an increase in detection. The researchers were confident it wasn’t, but we must remember the immortal words of Mandy Rice-Davies

Thirdly, what sort of study is it? Obviously it can’t be experimental, but a good study design would be to ask people about cycling (or even better, measure cycling) and then see whether it’s the bike fanatics who develop cancer. This study was a self-selected survey of cyclists, getting self-reported data about past cycling and past diagnosis of prostate cancer. It’s a fairly extreme sample, too: half of them cycle more than 5.75 hours per week.

Fourth, how strong is the evidence of association, and what sort of sample size are we looking at? The association is just barely statistically significant (p=0.046 in one model, p=0.025 in a second), and there are only 36 prostate cancer cases in the sample.  It’s pretty borderline.  The estimated relative risk is huge, because it has to be given the sample size, but the uncertainty range is also huge. The confidence interval on the relative risk of 5 reported by the Herald goes from 1.5 to 18.

Fifth, what does previous research say? This is in the story

‘To the best of our knowledge, this is the first study to demonstrate an association between prostate cancer and cycling, so there are no studies hypothesizing a pathophysiological mechanism for such a link.’

Sixth, what do other experts think? We don’t know. The closest thing to an independent comment is this in the press release

“Physicians should discuss the potential risks and health benefits of cycling with their patients, and how it may impact their overall health,” says Ajay Nehra, MD, Editor-in-Chief of Journal of Men’s Health and Chair, Department of Urology, Director, Men’s Health, Rush University Medical Center, Chicago, IL.

He could have said that without reading the paper.

In summary, there’s borderline evidence from a weak study design for a sensational finding that isn’t supported by any prior evidence. This is fine as research, but it shouldn’t be in the headlines.

You can read the research paper here for the next month, and the journal press release here.