Posts from May 2014 (77)

May 27, 2014

What’s a shot at $5million worth?

In March, the US billionaire Warren Buffett offered a billion dollar prize to anyone who could predict all 63 ‘March Madness’ college basketball games. Unsurprisingly, many tried but no-one succeeded.

The New Zealand TAB are offering NZ$5 million to anyone who can predict all 64 games in the 2014 World Cup (soccer, in Rio de Janeiro (probably)). It’s free to enter. What’s it worth to an entrant, and what is the expected cost to the TAB?

If the pool games had equal probability of win/loss/draw and the finals series games were 50:50, which is the worst case for punters (well, almost), the chance of winning would be 1 in 5,227,573,613,485,916,806,405,226,496. That’s presumably also your chance of winning if you use random picks, which the TAB helpfully provides. At those odds, the value of an entry is approximately 1 ten-thousand-million-billionth of a cent (10-19 cents), which is probably less than the cost to you of

By entering this Competition, an Entrant agrees to receive marketing and promotional material from the Promoter (including electronic material).

Of course, you could do better by picking carefully. Suppose that a dozen of the pool round games were completely predictable walkovers, the remaining 34 you could get  70% right, and you could get 50% for final games. That would be doing pretty well.  In that case the value of entering is hugely better — it’s almost a twentieth of a cent.   If you can get 70% accuracy for the final games as well, the value of entering would be nearly ten cents.

But if you can predict a dozen of the games with perfect accuracy and get 70% right for the rest, you’d be much better off just betting.  I looked at an online betting site, and the smallest payoffs I could find in the pool games were 2/9 for Brazil to beat Cameroon and 2/11 for Argentina to beat Iran.  If you have a dozen pool matches where you’re 100% certain, you can make rather more than ten cents even on a minimum bet.

So, what’s this all costing the TAB? It’s almost certainly less than the cost of sending a text message to every entrant, which is part of the process. There are maybe three million people eligible to enter, and a maximum of one entry per person. Given that duplicate winners will split the prize, I can’t really believe in an expected prize cost to TAB of more than 0.01 cents per entrant, which works out at about $1200 if every adult Kiwi enters. They should be able to insure against a win and pay not much more than this. The cost of advertising campaign will dwarf the prize costs.

The real incentive to enter is that there will be five $1000 consolation prizes for the best entries when no-one wins the big prize. What matters in figuring the odds for this  is not the total number of total entries (which might be a million), but the number of seriously competitive entries. That could be as low as a few tens of thousands, giving an expected value of entry as high as twenty cents if you’re prepared to put some effort into research.


[Update: It’s actually slightly worse than this, though not importantly so. You may need to predict numbers of goals scored in order to break ties when setting up the knockout rounds.]
May 26, 2014

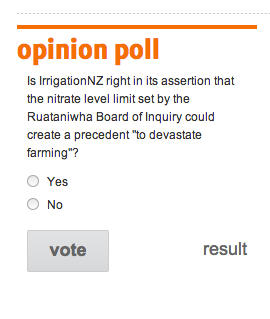
What’s wrong with this question?

ruitaniwha

I usually don’t bother with bogus polls on news stories, but this one (via @danyl) is especially egregious. It’s not just the way the question is framed, or the glaring lack of a “How the fsck would I know?” option. There are some questions that are just not a matter of opinion. After a bit of informed public debate, and collected in a meaningful way, the national opinion on “This is the impact on farming: is it worth it?” would be relevant. But not this.

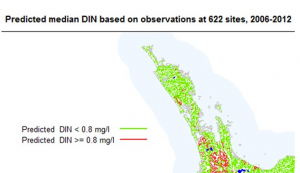
While we’re on this story, the map illustrating it is also notable. The map shows ‘Predicted median DIN’. Nowhere in the story is there any mention of DIN, let alone a definition. I suppose they figured it was a well-known abbreviation, and it’s true that if you ask Google, it immediately tells you. DIN is short for Deutsches Institut für Normung.

din


PS: yes, I know, Dissolved Inorganic Nitrogen

Stat of the Week Competition: May 24 – 30 2014

Each week, we would like to invite readers of Stats Chat to submit nominations for our Stat of the Week competition and be in with the chance to win an iTunes voucher.

Here’s how it works:

  • Anyone may add a comment on this post to nominate their Stat of the Week candidate before midday Friday May 30 2014.
  • Statistics can be bad, exemplary or fascinating.
  • The statistic must be in the NZ media during the period of May 24 – 30 2014 inclusive.
  • Quote the statistic, when and where it was published and tell us why it should be our Stat of the Week.

Next Monday at midday we’ll announce the winner of this week’s Stat of the Week competition, and start a new one.

(more…)

Stat of the Week Competition Discussion: May 24 – 30 2014

If you’d like to comment on or debate any of this week’s Stat of the Week nominations, please do so below!

May 23, 2014

Who did they survey again?

To seasoned readers of Stats Chat, the contradiction in the first two sentences of this article will be glaringly obvious:

“A survey released yesterday has found at least four in five Kiwis refuse to leave home without their smartphone in hand.

The survey, carried out by 2degrees on Facebook, asked 357 smartphone users about their habits.”

Meanwhile, there’s a better article about cellphones over here:

“As many as three in five New Zealanders own a smartphone, an online survey by British-based market researcher TNS shows.

Based on the 500 responses it received to its survey, TNS estimated smartphone ownership had jumped from 33 per cent to 60 per cent over the past year.

The fact that the survey was conducted online could mean it overstated the prevalence of devices such as smartphones.

Other surveys have put smartphone ownership at close to, or in some cases slightly above, 50 per cent.”

Is Roy Morgan weird?

There seems to be a view that the Roy Morgan political opinion poll is more variable than the others, even to the extent that newspapers are willing to say so, eg, Stuff on May 7

The National Party has taken a big hit in the latest Roy Morgan poll, shedding 6 points to 42.5 per cent in the volatile survey.

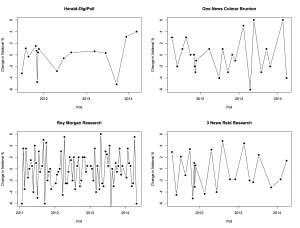
I was asked about this on Twitter this morning, so I went to get Peter Green’s data and aggregation model to see what it showed. In fact, there’s not much difference between the major polling companies in the variability of their estimates. Here, for example, are poll-to-poll changes in the support for National in successive polls for four companies

fourpollers


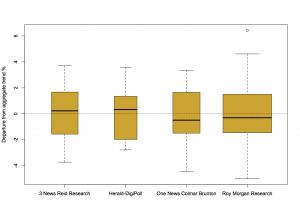
And here are their departures from the aggregated smooth trend

boxpollers


There really is not much to see here. So why do people feel that Roy Morgan comes out with strange results more often? Probably because Roy Morgan comes out with results more often.

For example, the proportion of poll-to-poll changes over 3 percentage points is 0.22 for One News/Colmar Brunton, 0.18 for Roy Morgan, and 0.23 for 3 News/Reid Research, all about the same, but the number of changes over 3 percentage points in this time frame is 5 for One News/Colmar Brunton, 14 for Roy Morgan, and 5 for 3 News/Reid Research.

There are more strange results from Roy Morgan than for the others, but it’s mostly for the same reason that there are more burglaries in Auckland than in the other New Zealand cities.

Distrust the center

Automated location information can be very useful, but if the ‘location’ is an area and the automated result is a single point, it’s easy to get misled.

May 22, 2014

Big Data social context

From Cathy O’Neil: Ignore data, focus on power (and, well, most of the stuff on her blog)

From danah boyd and Kate Crawford: Critical Questions for Big Data

Will large-scale search data help us create better tools, services, and public goods? Or will it usher in a new wave of privacy incursions and invasive marketing? Will data ana- lytics help us understand online communities and political movements? Or will it be used to track protesters and suppress speech? Will it transform how we study human communication and culture, or narrow the palette of research options and alter what ‘research’ means?  


A simple colour example

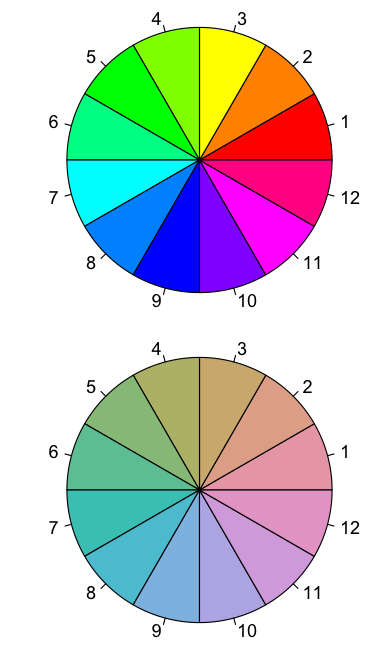
Two colour wheels, one using red-green-blue colour coordinates based on how monitors work, the other using a rescaled coordinate system based approximately on what the eye sees

angle


The second set of colours isn’t as dramatic, but they are much better at being evenly spaced around the circle and equally bright.

Briefly

Health and evidence edition

  • Evidently Cochrane, a blog with non-technical explanations of Cochrane Collaboration review results
  • Design process for a graphic illustrating the impact of motorbike helmet laws.  In contrast to bicycle helmet laws, laws for motorbikes do have a visible effect on death statistics
  • Stuff has quite a good story on alcohol in New Zealand.
  • The British Association of Dermatologists responds to ‘drinkable sunscreen’.
  • 3News piece on Auckland research into extracts of the lingzhi mushroom. Nice to see local science, and the story was reasonably balanced, with Shaun Holt pointing out that this is not even approaching being anywhere near evidence that drinking the stuff would do more good than harm.