Posts from April 2014 (60)

April 7, 2014

Stat of the Week Competition: April 5 – 11 2014

Each week, we would like to invite readers of Stats Chat to submit nominations for our Stat of the Week competition and be in with the chance to win an iTunes voucher.

Here’s how it works:

  • Anyone may add a comment on this post to nominate their Stat of the Week candidate before midday Friday April 11 2014.
  • Statistics can be bad, exemplary or fascinating.
  • The statistic must be in the NZ media during the period of April 5 – 11 2014 inclusive.
  • Quote the statistic, when and where it was published and tell us why it should be our Stat of the Week.

Next Monday at midday we’ll announce the winner of this week’s Stat of the Week competition, and start a new one.
(more…)

Stat of the Week Competition Discussion: April 5 – 11 2014

If you’d like to comment on or debate any of this week’s Stat of the Week nominations, please do so below!

April 5, 2014

Oh what a difference a bit of formatting makes

A nice animated GIF showing what difference a small amount of simple formatting can make to a simple table. You may need to click on the image.

ZY8dKpA

April 4, 2014

Thomas Lumley’s latest Listener column

…”One of the problems in developing drugs is detecting serious side effects. People who need medication tend to be unwell, so it’s hard to find a reliable comparison. That’s why the roughly threefold increase in heart-attack risk among Vioxx users took so long to be detected …”

Read his column, Faulty Powers, here.

April 2, 2014

NRL Predictions for Round 5

Team Ratings for Round 5

The basic method is described on my Department home page. I have made some changes to the methodology this year, including shrinking the ratings between seasons.

Here are the team ratings prior to this week’s games, along with the ratings at the start of the season.

Current Rating Rating at Season Start Difference
Roosters 10.04 12.35 -2.30
Sea Eagles 7.46 9.10 -1.60
Bulldogs 5.96 2.46 3.50
Storm 4.26 7.64 -3.40
Rabbitohs 3.70 5.82 -2.10
Knights 3.68 5.23 -1.50
Cowboys 2.49 6.01 -3.50
Broncos -0.06 -4.69 4.60
Titans -0.45 1.45 -1.90
Panthers -1.49 -2.48 1.00
Warriors -2.62 -0.72 -1.90
Sharks -4.35 2.32 -6.70
Raiders -4.46 -8.99 4.50
Dragons -5.00 -7.57 2.60
Wests Tigers -8.05 -11.26 3.20
Eels -12.89 -18.45 5.60


Performance So Far

So far there have been 32 matches played, 14 of which were correctly predicted, a success rate of 43.8%.

Here are the predictions for last week’s games.

Game Date Score Prediction Correct
1 Roosters vs. Sea Eagles Mar 28 0 – 8 10.40 FALSE
2 Dragons vs. Broncos Mar 28 20 – 36 3.00 FALSE
3 Warriors vs. Wests Tigers Mar 29 42 – 18 6.80 TRUE
4 Eels vs. Panthers Mar 29 32 – 16 -11.70 FALSE
5 Bulldogs vs. Storm Mar 29 40 – 12 1.60 TRUE
6 Rabbitohs vs. Raiders Mar 30 18 – 30 17.70 FALSE
7 Knights vs. Sharks Mar 30 30 – 0 8.80 TRUE
8 Titans vs. Cowboys Mar 31 13 – 12 1.80 TRUE


Predictions for Round 5

Here are the predictions for Round 5. The prediction is my estimated expected points difference with a positive margin being a win to the home team, and a negative margin a win to the away team.

Game Date Winner Prediction
1 Roosters vs. Bulldogs Apr 04 Roosters 8.60
2 Broncos vs. Eels Apr 04 Broncos 17.30
3 Sharks vs. Warriors Apr 05 Sharks 2.80
4 Panthers vs. Raiders Apr 05 Panthers 7.50
5 Dragons vs. Rabbitohs Apr 05 Rabbitohs -4.20
6 Storm vs. Titans Apr 06 Storm 9.20
7 Wests Tigers vs. Sea Eagles Apr 06 Sea Eagles -11.00
8 Cowboys vs. Knights Apr 07 Cowboys 3.30


Super 15 Predictions for Round 8

Team Ratings for Round 8

The basic method is described on my Department home page. I have made some changes to the methodology this year, including shrinking the ratings between seasons.

Here are the team ratings prior to this week’s games, along with the ratings at the start of the season.

Current Rating Rating at Season Start Difference
Sharks 7.29 4.57 2.70
Crusaders 5.32 8.80 -3.50
Chiefs 4.96 4.38 0.60
Bulls 3.90 4.87 -1.00
Brumbies 3.44 4.12 -0.70
Waratahs 3.40 1.67 1.70
Stormers 1.46 4.38 -2.90
Hurricanes 0.19 -1.44 1.60
Reds -0.18 0.58 -0.80
Blues -0.76 -1.92 1.20
Cheetahs -3.67 0.12 -3.80
Lions -4.03 -6.93 2.90
Force -4.07 -5.37 1.30
Highlanders -4.34 -4.48 0.10
Rebels -5.91 -6.36 0.40


Performance So Far

So far there have been 42 matches played, 26 of which were correctly predicted, a success rate of 61.9%.

Here are the predictions for last week’s games.

Game Date Score Prediction Correct
1 Crusaders vs. Hurricanes Mar 28 26 – 29 9.10 FALSE
2 Rebels vs. Brumbies Mar 28 32 – 24 -8.90 FALSE
3 Blues vs. Highlanders Mar 29 30 – 12 4.40 TRUE
4 Reds vs. Stormers Mar 29 22 – 17 1.90 TRUE
5 Bulls vs. Chiefs Mar 29 34 – 34 3.40 FALSE
6 Sharks vs. Waratahs Mar 29 32 – 10 5.90 TRUE


Predictions for Round 8

Here are the predictions for Round 8. The prediction is my estimated expected points difference with a positive margin being a win to the home team, and a negative margin a win to the away team.

Game Date Winner Prediction
1 Highlanders vs. Rebels Apr 04 Highlanders 5.60
2 Brumbies vs. Blues Apr 04 Brumbies 8.20
3 Hurricanes vs. Bulls Apr 05 Hurricanes 0.30
4 Reds vs. Force Apr 05 Reds 6.40
5 Cheetahs vs. Chiefs Apr 05 Chiefs -4.60
6 Lions vs. Crusaders Apr 05 Crusaders -5.40
7 Stormers vs. Waratahs Apr 05 Stormers 2.10


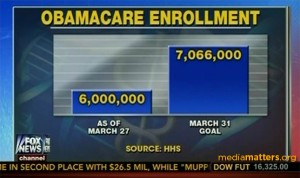
Why barcharts must start at zero

From Fox News last week (via)

obamacareenrollment-fncchart

My edit based on what ended up happening

Slide1


If the magnitudes don’t matter, the graph can’t be worth the pixels it’s printed on.


Census meshblock files: all the datas

Statistics New Zealand has just released the meshblock-level data from last year’s Census, together with matching information for the previous two censuses (reworked to use the new meshblock boundaries).

Mashblock shows one thing that can be built with this sort of data, there are many others.

Get your meshblock files here

Drug use trends

There’s an interesting piece in Stuff about Massey’s Illegal Drug Monitoring System. I’d like to make two points about it.

First, the headline is that synthetic cannabis use is declining. That’s good, but it’s in a survey of frequent users of illegal drugs.  If you have the contacts and willingness to buy illegal drugs, it isn’t surprising that you’d prefer real cannabis to the synthetics — there seems to be pretty universal agreement that the synthetics are less pleasant and more dangerous.  This survey won’t pick up trends in more widespread casual use, or in use by teenagers, which are probably more important.

Second, the study describes the problems caused by much more toxic new substitutes for Ecstacy and LSD. This is one of the arguments for legalisation. On the other hand, they are also finding increased abuse of prescription oxycodone. This phenomenon, much more severe in the US, weakens the legalisation argument somewhat.  Many people (including me) used to believe, based on reasonable evidence, that a substantial fraction of the adverse health impact of opioid addiction was due to the low and unpredictably-varying purity of street drugs, and that pure, standardised drugs would reduce overdoses. As Keith Humphreys describes, this turns out not to be the case.


Big data: are we making a big mistake?

Just a quick pointer to a nice opinion piece by the Financial Times’ “Undercover Economist” and star of BBC Radio 4’s excellent “More or Less” podcast, Tim Harford. Tim very nicely argues that in the hype over big data, stories of the failures of simplistic, correlation driven approaches rarely get airtime, and hence we get a misleading impression about the efficacy of these techniques.