Posts from April 2014 (60)

April 9, 2014

Super 15 Predictions for Round 9

Team Ratings for Round 9

The basic method is described on my Department home page. I have made some changes to the methodology this year, including shrinking the ratings between seasons.

Here are the team ratings prior to this week’s games, along with the ratings at the start of the season.

Current Rating Rating at Season Start Difference
Sharks 7.29 4.57 2.70
Crusaders 6.27 8.80 -2.50
Chiefs 4.65 4.38 0.30
Waratahs 4.21 1.67 2.50
Brumbies 4.00 4.12 -0.10
Bulls 3.58 4.87 -1.30
Stormers 0.66 4.38 -3.70
Hurricanes 0.51 -1.44 1.90
Reds -0.78 0.58 -1.40
Blues -1.33 -1.92 0.60
Cheetahs -3.35 0.12 -3.50
Force -3.47 -5.37 1.90
Highlanders -4.52 -4.48 -0.00
Lions -4.99 -6.93 1.90
Rebels -5.73 -6.36 0.60


Performance So Far

So far there have been 49 matches played, 30 of which were correctly predicted, a success rate of 61.2%.

Here are the predictions for last week’s games.

Game Date Score Prediction Correct
1 Highlanders vs. Rebels Apr 04 33 – 30 5.60 TRUE
2 Brumbies vs. Blues Apr 04 26 – 9 8.20 TRUE
3 Hurricanes vs. Bulls Apr 05 25 – 20 0.30 TRUE
4 Reds vs. Force Apr 05 29 – 32 6.40 FALSE
5 Cheetahs vs. Chiefs Apr 05 43 – 43 -4.60 FALSE
6 Lions vs. Crusaders Apr 05 7 – 28 -5.40 TRUE
7 Stormers vs. Waratahs Apr 05 11 – 22 2.10 FALSE


Predictions for Round 9

Here are the predictions for Round 9. The prediction is my estimated expected points difference with a positive margin being a win to the home team, and a negative margin a win to the away team.

Game Date Winner Prediction
1 Highlanders vs. Bulls Apr 11 Bulls -4.10
2 Reds vs. Brumbies Apr 11 Brumbies -2.30
3 Chiefs vs. Rebels Apr 12 Chiefs 14.40
4 Force vs. Waratahs Apr 12 Waratahs -5.20
5 Cheetahs vs. Crusaders Apr 12 Crusaders -5.60
6 Lions vs. Sharks Apr 12 Sharks -9.80


Briefly

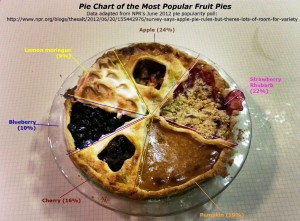
Pie chart edition

piechartpie_custom-04484aacfec019c8444fa1b42dbdb33f71b80ed9-s40-c85

I couldn’t possibly comment

Two excerpts from Gavin White’s  SAYit blog:

The flag

The specific question was “do you think the New Zealand flag should be changed?”.  The answers were:

  • Yes 19%
  • No 77%
  • Unsure 4%

And on conspiracy theories

…the moon landing:

  • 20% of us think that it’s likely that the United States of America government staged or faked the Apollo moon landing (5% very likely, 15% somewhat likely)
  • 74% think it’s unlikely
  • 6% are unsure or haven’t heard of this conspiracy before..

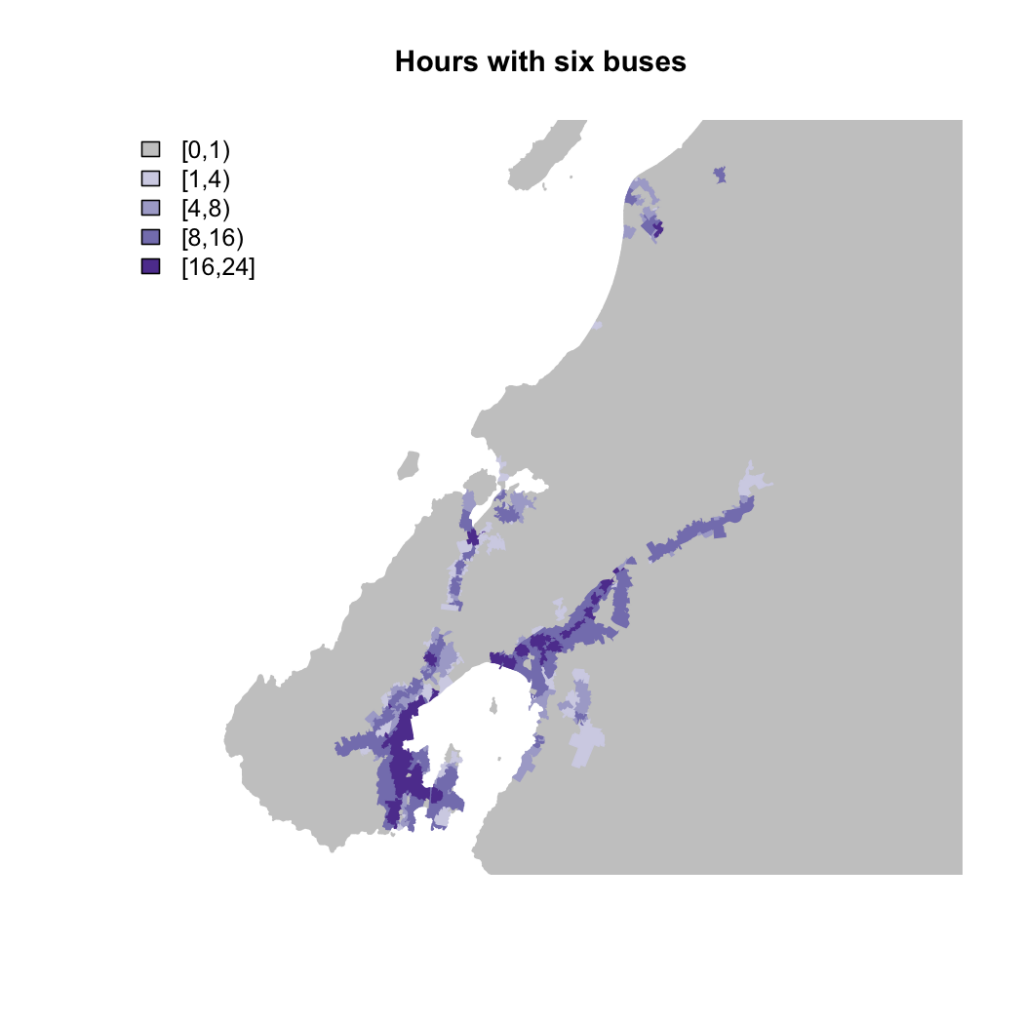
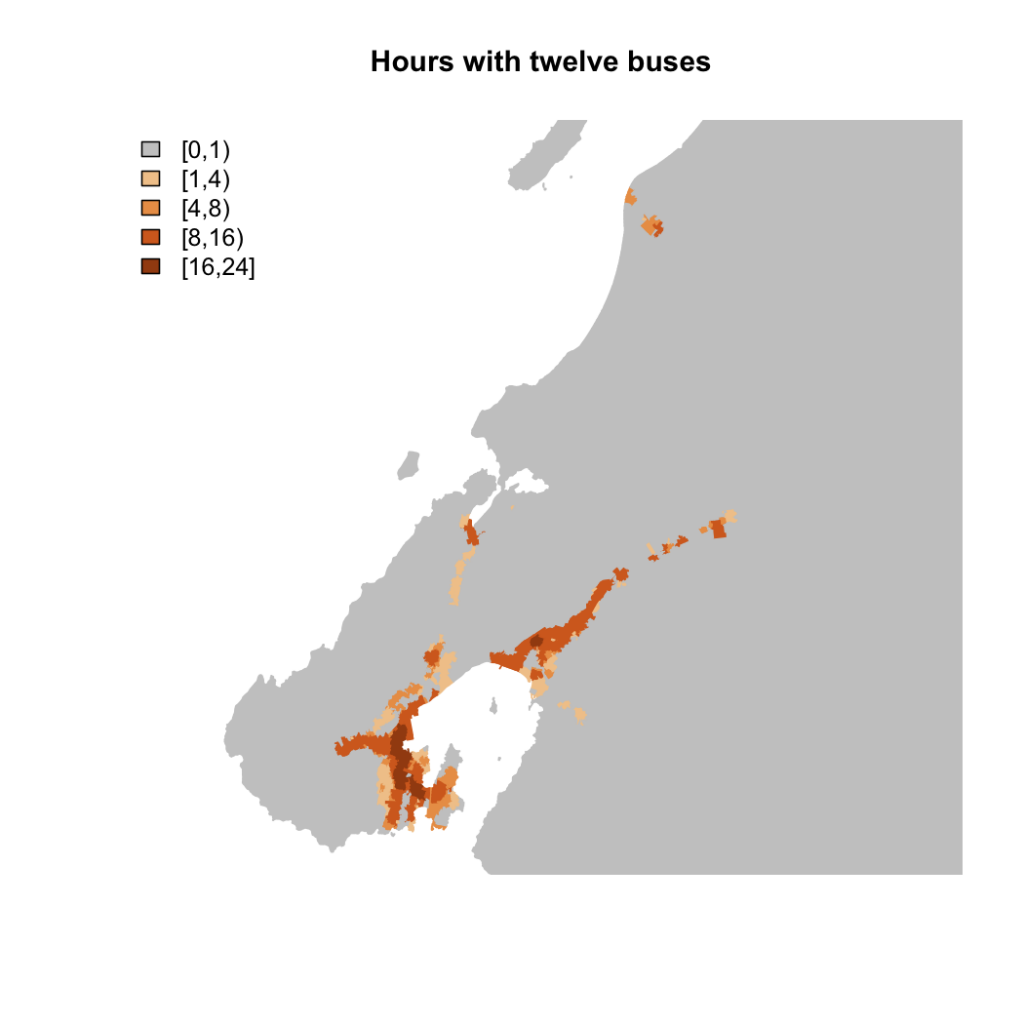
Busable Wellington

In response to a reader request, here are the same bus service maps as for Auckland. Again, click for big PDF files so you can zoom in.  I think these include non-bus transit, but I’m not completely sure.

Hours per day with at least six transit trips within 500m

wellybus6png


Hours per day with at least 12 transit trips within 500m

wellybus12png


In the Wellington region it seems that people who have any bus service have a useful amount.

The region as a whole has a smaller proportion of people with good public transport than Auckland region (7% in the top category, 60% in the bottom), but if we restrict to Wellington City there are 17% in the top category, 26% in the next, and only 30% in the lowest.


[Update: Here’s a version with a 1km distance instead of 500m]


April 8, 2014

Asthma inhalers and diet: shorter, with more swearing

Ok, so the previous post is about Herald (Daily Mail) story on asthma research. As science reporting goes it’s no worse than usual for these Mail reprints. The reason for this second post is that I read the story again and thought about health reporting.

The story lead says

Eating fast food and consuming sugary drinks renders the most common asthma inhaler ineffective, a study warns.

 That is, the Herald is telling people their emergency asthma inhaler will not work if they eat certain foods. There’s no suggestion of what to do instead in an attack or who to call for help. Even if the claim were true, that would be irresponsible. When it’s just linkbait, it’s fscking appalling.

Overinterpreting diet and asthma

The Herald’s lead

Eating fast food and consuming sugary drinks renders the most common asthma inhaler ineffective, a study warns.

This is two studies. One looked at a ‘dietary inflammation index’ and whether people with higher values were more likely to be asthmatic. It did not look at inhaler effectiveness at all.  The dietary inflammation index does not measure ‘sugary drinks’; it treats all carbohydrate the same. It doesn’t directly measure fast food, though it does distinguish different types of fat.  Since the dietary inflammation index, according to the paper that proposed it, is relatively weakly associated with biological measures of inflammation,  the strong association seen in this study between the index and asthma may just mean that other factors are affecting both asthma and diet.

The other study looked at how salbutamol, the active ingredient of the Ventolin inhaler, was absorbed in samples of lung tissue in the lab. The amount of polyunsaturated fat affected absorption — but that wasn’t dietary fat and there weren’t any inhalers, or any sugary drinks.  Further research might show this translates into real differences in inhaler effectiveness, or it might not.

So, while there is actual science described in the article, there is almost no support for the lead. No inhalers, no sugary drinks, no fast food.

You might also wonder why the Herald is getting a comment from Asthma UK for research presented at a conference of the Thoracic Society of Australia and New Zealand. Or not.

Busable Auckland

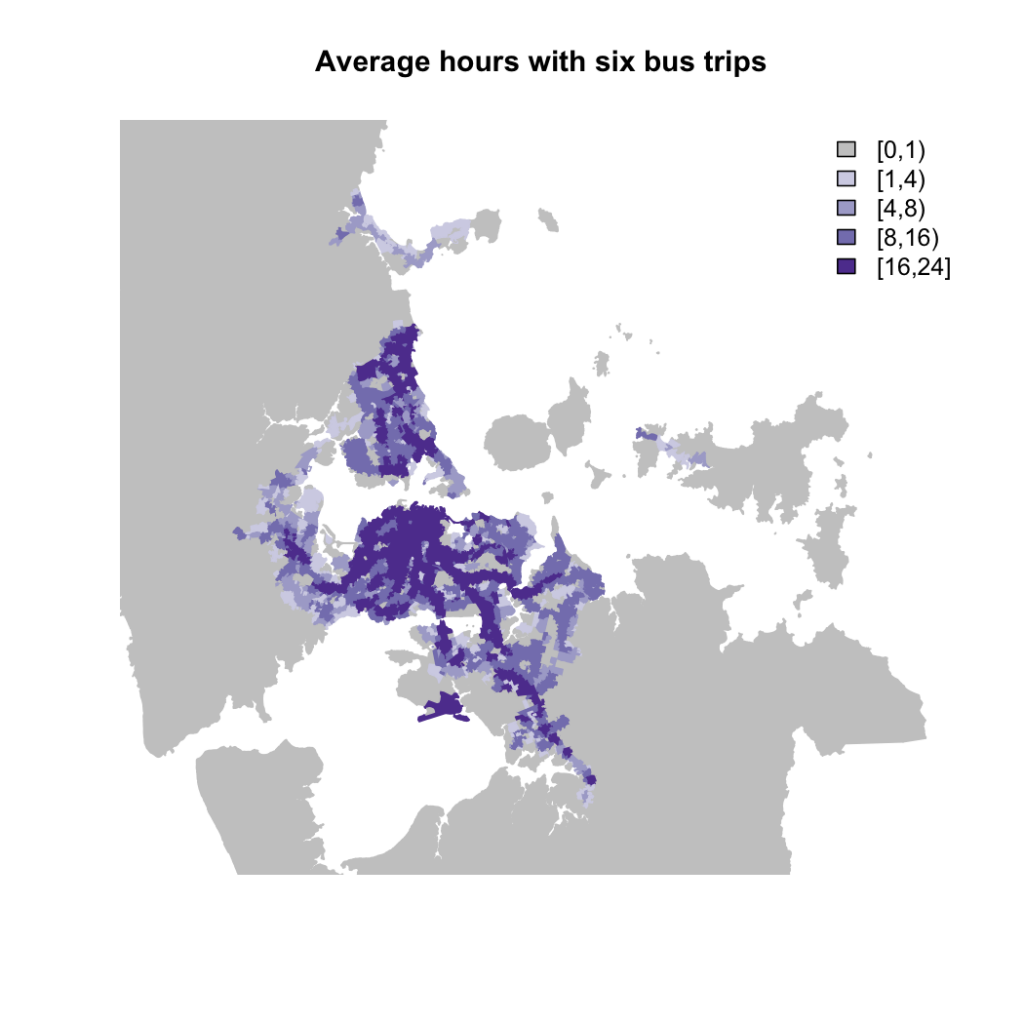
Bus commuter services can be very useful in reducing traffic and parking congestion in the city center, but reducing the average number of cars per household requires buses that are available all the time. I used the Auckland Transport bus schedule data and the new StatsNZ meshblock data and boundary files

Here’s a map of Auckland showing how many hours per day (on average) there are at least six bus trips per hour stopping within 500m of each meshblock (actually, within 500m of the ‘label point’ for the meshblock).

On a single road, six trips per hour is one trip in each direction every twenty minutes. The dark purple area has this level of service at least 16 hours a day on average. (Click for the honking great PDF version.)

bus6png

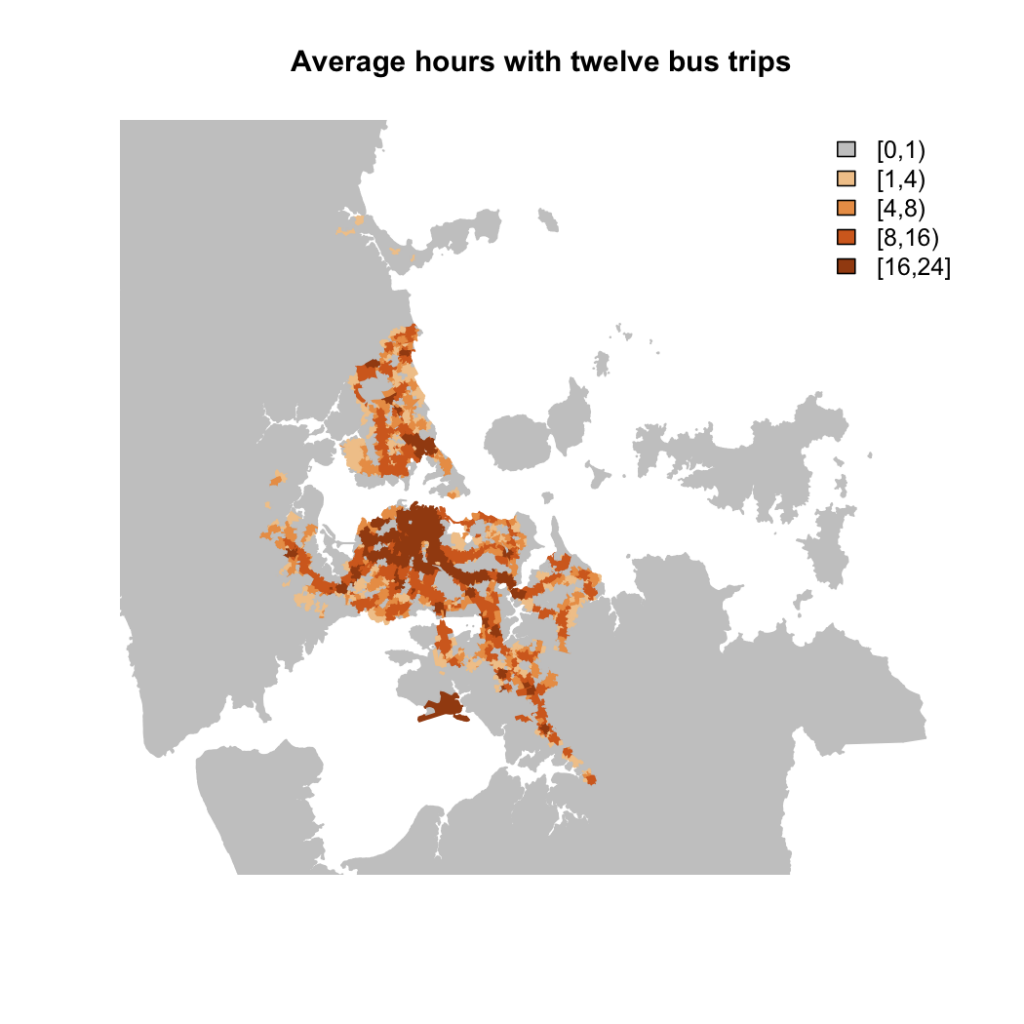
For twelve trips per hour (eg, one every twenty minutes on two different routes) the area shrinks a lot

bus12png

The reason for using meshblocks in the map is that we can merge the bus files with the census files. For example, for Auckland as a whole, 50% of the population is in the grey busless emptiness, 17% in the 8-16 hour tolerable zone, and 12% in the pretty reasonable 16+ hour zone.   People of Maori descent are more likely to be unbused (60%) and less likely to be well bused (8%), as are people over 65 (60% in the lowest category, 9% in the highest).

Recent (<10 years) migrants like transit: 18% of us are in the good bus category and only 40% in the busless category.

Another phony poll?

The flipside of failing to question numbers is assuming that anyone who does question them is correct (from US journalism/editing blog headsup)

Hence, even though in this case it’s an out-and-out lie, “another phony poll” doesn’t just resonate around the echo chamber; it puts a bug in the grownup world’s ear too. It looks like what journalism is supposed to be doing. Polls are suspect anyway (being based on data, which is inferior to gut feelings and news sense), and catching a fake one is a triumph of  the common man over the spinmeisters

On talking to people

April 7, 2014

Stat of the Week Winner: March 29 – April 4 2014

Congratulations to Myles Thomas who is our Stat of the Week winner this week for nominating the following poll question:

“Statistic: In the latest 3 News-Reid Research poll, when asked if David Cunliffe’s actions were worthy of a Prime Minister, 65 percent of voters, almost two-thirds, said “no”, while only 27 percent said “yes”.

As Russell Brown points out – this question is ludicrous. What does that even mean? That people think he’s not fit to be Prime Minister? That it was an unworthy action of someone who aspired to be Prime Minister one day? It’s actually a hard question for even a Cunliffe supporter to answer “yes” to. As a bit of emotional framing it works well, as a research question it’s bullshit.

This seems to be a news company engaging in dodgy push-polling and the claiming the inevitable but meaningless result is news. Wrong on several levels.”