Posts from April 2014 (60)

April 14, 2014

Peak car?

From the Herald, quoting the chief executive of Z Energy:

“People are doing online shopping and Skyping granny rather than making the fortnightly visit.”

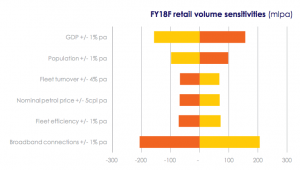
A 1 per cent improvement in broadband connectivity is estimated to cause a drop of 200 million litres a year in national fuel demand, more than the impact of GDP growth, population, fleet turnover, vehicle efficiency and the petrol price.

The first question here is on units. For broadband, it’s fuel demand per 1% of connections, but what are the units for the others?

There’s a bit more detail in this set of slides, including this picture, where the orange bar shows the estimated effect of an increase in the factor and the yellow bar shows the estimated effect of the same decrease.
z-trends
So if we believe these numbers, a 1% point increase in broadband has slightly larger impact than a 1% increase in GDP and about twice the impact of a 1% increase in population.

For this model to be useful in prediction, which is what Z Energy presumably made it for, there’s no need that these statistical associations are causal. It’s only necessary that they persist at roughly the same strength through the period of the forecast.  The associations can’t really be true under serious extrapolation. For example, reducing broadband coverage from the current roughly 80% of households to zero would probably not cause transport fuel use to rise by 16 billion litres — ie, more than triple. Similarly, it can’t really be true that the impact nominal petrol prices is independent of inflation or income trends. For prediction this doesn’t necessarily matter, but for interpreting causes it does.

The actual prediction impact of broadband depends on how much it will increase. It turns out that the model says the reduction due to broadband plus the reduction due to increasing petrol prices approximately cancels out the increase due to increasing GDP. So, in fact, in the Z Energy model, broadband is less important than GDP growth. The model ends up predicting that per-capita travel will be roughly constant,  that total travel will increase with population, and that fuel efficiency will increase.

So, is the broadband association causal? It easily could be. There’s evidence from other countries of a reduction in driving that can’t entirely be attributed to the Great Recession. This is especially true among young people, with more socialising electronically. Telecommuting probably plays a role, too. I’m not convinced that online shopping has had a big impact on car trips in NZ, but it could have.  On the other hand, there huge uncertainty in the size of the effect — not just statistical uncertainty based on the data, but uncertainty about what’s fundamentally going on.

Finally, one depressing, but probably accurate, feature of the predictions is that they assume we still won’t be doing anything about climate change by 2018.

Stat of the Week Winner: April 5 – 11 2014

Thanks to James Green for nominating this fascinating statistic (if true):

“A 1 per cent improvement in broadband connectivity is estimated to cause a drop of 200 million litres a year in national fuel demand”

The NZ Herald quoted this (without attribution) but Thomas Lumley tracked down the source of the statistic to a report by Z Energy. The report contains no further details on the statistic.

James wrote:

“Would be fascinating if true, but without them revealing an actual source, seems difficult and barely credible to firmly link these two.”

Congratulations James for being our Stat of the Week Winner!

Stat of the Week Competition: April 12 – 18 2014

Each week, we would like to invite readers of Stats Chat to submit nominations for our Stat of the Week competition and be in with the chance to win an iTunes voucher.

Here’s how it works:

  • Anyone may add a comment on this post to nominate their Stat of the Week candidate before midday Friday April 18 2014.
  • Statistics can be bad, exemplary or fascinating.
  • The statistic must be in the NZ media during the period of April 12 – 18 2014 inclusive.
  • Quote the statistic, when and where it was published and tell us why it should be our Stat of the Week.

Next Monday at midday we’ll announce the winner of this week’s Stat of the Week competition, and start a new one.

(more…)

Stat of the Week Competition Discussion: April 12 – 18 2014

If you’d like to comment on or debate any of this week’s Stat of the Week nominations, please do so below!

April 13, 2014

Housing affordability map

Saeid Adli and Alex Raichev have made interactive maps of Auckland and Wellington that try to combine the cost of housing (rent) and commuting, and present it as a fraction of income.  You can select income, house size, mode of transport, how often you commute, etc.

They also provide an explanation of how they do the calculations, and all the code and data.

Briefly

April 11, 2014

Past performance no guarantee of future results

From the ACC

Julius Caesar was warned to beware the ‘Ides of March’. And perhaps Kiwis should take extra caution this Sunday.

That’s because April the 13th last year was the day on which the highest number of injuries happened during 2013.

Of course, April 13th wasn’t a Sunday last year. ACC helpfully give us the top five days last year for injuries

  • 13 April – 8,067 claims
  • 6 April – 8,024 claims
  • 11 May – 7,988 claims
  • 18 May – 7,757 claims
  • 8 June – 7,732 claims.

What do all these days have in common? Well, let’s just say that the ACC warning for Sunday April 13 may be a bit late.


The favourite never wins?

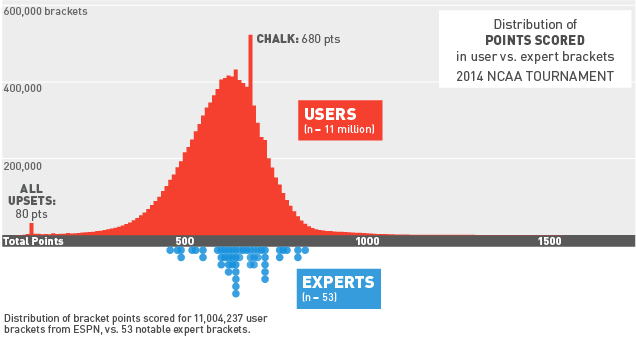
From Deadspin, an analysis of accuracy in 11 million tournament predictions (‘brackets’) for the US college basketball competition, and 53 predictions by experts

s33yj1vrb8bx7dtfyenw


Stephen Pettigrew’s analysis shows the experts average more points than the general public (651681 vs 604.4). What he doesn’t point out explicitly is that picking the favourites, which corresponds to the big spike at 680 points, does rather better than the average expert.


April 10, 2014

Frittering away

Q: Did you see that “some generation Y foodies are spending up to $600 a week on gourmet produce such as seafood, cheeses, olives and cured hams.”

A: In the Herald? Yes.

Q: Is it true?

A: Slightly.

Q: Who are these people?

A: Well, for a start, they’re Australians

Q: Oh. How many is “some”

A: At least one.

Q: No, seriously, how many?

A: 1% of a the 18-34 subset of a sample of ‘over’ 1000. Here’s the full report

Q: How many is that?

A: Maybe three in the sample?

Q: Three people or three households?

A: A good question. They don’t say, though the average weekly food expenditure in their sample looks reasonably close to the national household average that they cite.

Q: How were the people sampled?

A: They don’t say.

Q: How many were Generation Y?

A: They don’t say

Q: How did they even define ‘gourmet food’? Or don’t they say that either?

A: Sadly, no.

Q: This report doesn’t seem to follow the code of practice you blogged about recently, does it?

A: That was just for political polls, and anyway this report is Australian.

Q: Is there anything else you want to complain about in the report?

A: If  you call it an “Inaugural” report you really can’t use it to conclude “Australians are becoming a more food savvy nation”.


April 9, 2014

NRL Predictions for Round 6

Team Ratings for Round 6

The basic method is described on my Department home page. I have made some changes to the methodology this year, including shrinking the ratings between seasons.

Here are the team ratings prior to this week’s games, along with the ratings at the start of the season.

Current Rating Rating at Season Start Difference
Roosters 9.12 12.35 -3.20
Bulldogs 6.88 2.46 4.40
Rabbitohs 5.14 5.82 -0.70
Sea Eagles 5.13 9.10 -4.00
Cowboys 4.48 6.01 -1.50
Storm 3.21 7.64 -4.40
Knights 1.69 5.23 -3.50
Titans 0.61 1.45 -0.80
Panthers -1.66 -2.48 0.80
Sharks -1.93 2.32 -4.30
Broncos -2.18 -4.69 2.50
Raiders -4.29 -8.99 4.70
Warriors -5.04 -0.72 -4.30
Wests Tigers -5.72 -11.26 5.50
Dragons -6.44 -7.57 1.10
Eels -10.77 -18.45 7.70


Performance So Far

So far there have been 40 matches played, 18 of which were correctly predicted, a success rate of 45%.

Here are the predictions for last week’s games.

Game Date Score Prediction Correct
1 Roosters vs. Bulldogs Apr 04 8 – 9 8.60 FALSE
2 Broncos vs. Eels Apr 04 18 – 25 17.30 FALSE
3 Sharks vs. Warriors Apr 05 37 – 6 2.80 TRUE
4 Panthers vs. Raiders Apr 05 12 – 6 7.50 TRUE
5 Dragons vs. Rabbitohs Apr 05 6 – 26 -4.20 TRUE
6 Storm vs. Titans Apr 06 26 – 28 9.20 FALSE
7 Wests Tigers vs. Sea Eagles Apr 06 34 – 18 -11.00 FALSE
8 Cowboys vs. Knights Apr 07 28 – 2 3.30 TRUE


Predictions for Round 6

Here are the predictions for Round 6. The prediction is my estimated expected points difference with a positive margin being a win to the home team, and a negative margin a win to the away team.

Game Date Winner Prediction
1 Panthers vs. Rabbitohs Apr 11 Rabbitohs -2.30
2 Titans vs. Broncos Apr 11 Titans 7.30
3 Raiders vs. Knights Apr 12 Knights -1.50
4 Eels vs. Roosters Apr 12 Roosters -15.40
5 Wests Tigers vs. Cowboys Apr 12 Cowboys -5.70
6 Warriors vs. Bulldogs Apr 13 Bulldogs -7.40
7 Sea Eagles vs. Sharks Apr 13 Sea Eagles 11.60
8 Storm vs. Dragons Apr 14 Storm 14.10