Posts from March 2014 (59)

March 11, 2014

Predicting dementia

The Herald has a story about a potential blood test for dementia, which gives the opportunity to talk about an important statistical issue. The research seems to be good, and the results are plausible, though they need to be confirmed in a separate, larger sample before they can really be believed. Also, the predictions so far are just for mild cognitive impairment, not actual dementia. But it’s the description of the accuracy of the test that might be misleading.

The test had 90% sensitivity — 90% of who developed cognitive impairment tested positive. It had 90% specificity — 90% of those who who did not develop cognitive impairment tested negative.  That’s what is described in the story as 90% accuracy.  What a user would care about is the positive predictive value: if you test positive, how likely are you to get cognitive impairment?

In the study 451 people started out cognitively normal; 28 of these developed impairment, the other 423 did not. The test would be correctly positive for about 25 of the 28, and correctly negative for about 381 of the 423. So, of the 25+42=67 who test positive, less than 40% will develop impairment. That’s reasonable for a  diagnostic test but a bit low for a screening test in healthy people.

Where the test is more immediately relevant is in designing clinical trials. So far, attempts to affect Alzheimer’s Disease progression have failed, though there are some modestly effective symptomatic treatments. It’s possible that the treatments are doing the right thing but that clinical illness is too late, so there’s a lot of interest in testing treatments very early in the process. A test like the new one could be very useful
March 10, 2014

Stat of the Week Competition: March 8 – 14 2014

Each week, we would like to invite readers of Stats Chat to submit nominations for our Stat of the Week competition and be in with the chance to win an iTunes voucher.

Here’s how it works:

  • Anyone may add a comment on this post to nominate their Stat of the Week candidate before midday Friday March 14 2014.
  • Statistics can be bad, exemplary or fascinating.
  • The statistic must be in the NZ media during the period of March 8 – 14 2014 inclusive.
  • Quote the statistic, when and where it was published and tell us why it should be our Stat of the Week.

Next Monday at midday we’ll announce the winner of this week’s Stat of the Week competition, and start a new one.

(more…)

Stat of the Week Competition Discussion: March 8 – 14 2014

If you’d like to comment on or debate any of this week’s Stat of the Week nominations, please do so below!

March 9, 2014

Briefly

  • Rafa, at Simply Statistics, shows that countries with higher GDP per capita also tend to have had women voting for longer. Yes, he does know about correlation and causation.
  • Felix Salmon writes about, essentially, Bayesian updating given conflicting information the probability that Dorian is Satoshi would seem to be very small, and the the probability that Dorian is not Satoshi would seem to be just as small — and yet, somehow, when you add the two probabilities together, the total needs to come to something close to 100%.
  • Viz for a cause, an new archive of for data visualisations advocating on various causes. The current examples come from Tableau Public, which might be worth a look for online displays.
  • Andrew Gelman onHow much time (if any) should we spend criticizing research that’s fraudulent, crappy, or just plain pointless?” You can tell my answer from StatsChat. When it’s just consenting scientists in the journals, I’ve got better things to do. When there’s enough PR applied to get it into the NZ media, I try to respond. Sometimes it’s bad science; often it’s perfectly good underlying science and bad press releases. Remember, almost nothing from the scientific literature gets into the papers accidentally. Someone — the scientist, the journal, the university — has to push.
March 7, 2014

Careers in statistics

From Science Careers

“[The Bureau of Labor Statistics] projects that statistics jobs will grow 27% from 2012 to 2022, putting the profession in the “much faster than the average for all occupations” growth category. The bureau puts statisticians’ median annual salary in 2012 at $75,560.

In addition to having a different quote from Hal Varian than the one you were expecting, they talk to statisticians including Xihong Lin and Montse Fuentes.

Graphics design rules

1. Barcharts must start at zero,  from Storytelling with Data

2. Infographics as a proxy for overall news quality (barcharts must start at zero), from The Functional Art

3. And, from Storytelling with Data, perhaps the worst use of colour ever in donut charts. Statisticians keep saying it’s hard to compare pie/donut charts reliably. Notice how the two donuts below look very similar? Now try looking at the legends

donut

Remember: U and DON’T makes DONUT.

March 6, 2014

Attack of the killer lamb?

Not, not that one, the story about eating meat.

Stuff has the more egregious version “Eating meat ‘as bad as smoking‘”, the Herald has the rather better “Protein packed diet nearly as bad as smoking – expert”.

First, the good bits. Both stories are better than the UK versions: the Herald talks to Australian experts and brings in a related study; the Fairfax story at least mentions an outside scientific opinion and gives a link (though it’s to the university press release, which doesn’t link further to the research paper).

The researchers compared people who ate high-protein diet (just under 20% of the people) to those who ate a low-protein diet (just over 5%), and found a 70% higher rate of death in the high-protein group, in people aged 55-64.  The study was observational, but it was in a representative sample of the US and was backed up by experiments in mice. That’s not completely reliable,  but it is a big step.

The 70%-higher-rate of death for  high-protein vs low-protein diets compares to slightly over 100% higher rate for current smokers vs non-smokers in previous research using data from the same survey. You could get away with calling that ‘nearly as bad’, especially as other surveys have tended to give smaller differences. So, the Herald’s headline is defensible. Stuff’s headline drops the ‘nearly’, the ‘packed’ and refers to ‘meat’ rather than ‘protein’. It would be easy for a casual reader to get the false impression that the research had found eating meat was as bad as smoking.

There are two really big holes in the coverage, though.  The Herald alludes to one of them but doesn’t follow up 

People on high-protein diets are likely to lose years of life along with the weight they shed, according to two studies.

All the statistical analyses in the paper attempted to control for weight, ie, they were trying to compare people on high and low protein diets with the same weight. That’s not the relevant question for many people on these diets — the attraction of the diet is that it’s easier to lose weight.  The relevant question for them is a comparison between a high-protein diet with lower weight or a low-protein diet with higher weight.  That question could have been addressed with the data, but it wasn’t.

A rather less subtle omission is that neither story, nor the press release, mentions a key point of the paper: that the association reverses in people over 65.

March 5, 2014

Planes and buses

Maps from James Davenport

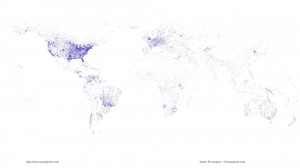
First, the world’s airport runways (go to his site for all the  details)

airports


You can see which bits of central Australia have farms or mines. Another interesting feature is the chain of evenly-spaced runways across far northern Canada — the DEW line.

He also has a video showing locations of all the buses in Seattle, over a 24-hour period. Like Auckland, Seattle has a real-time bus location system. Unlike Auckland’s system it produces openly-accessible data.

March 4, 2014

Briefly

  • Auckland Counts: local maps of NZ Census data thanks to Auckland Council RIMU. (via @kamal_hothi)

Civil Rights Principles for the Era of Big Data

From a mostly left-wing (ie, NZ middle-of-the-road) group of US civil-rights organisations, but at least some of it will also appeal to libertarians. If you think this sort of thing is interesting/important a good place to find more is mathbabe.org.

Technological progress should bring greater safety, economic opportunity, and convenience to everyone. And the collection of new types of data is essential for documenting persistent inequality and discrimination. At the same time, as new technologies allow companies and government to gain greater insight into our lives, it is vitally important that these technologies be designed and used in ways that respect the values of equal opportunity and equal justice. We aim to:

  1. Stop High-Tech Profiling. New surveillance tools and data gathering techniques that can assemble detailed information about any person or group create a heightened risk of profiling and discrimination. Clear limitations and robust audit mechanisms are necessary to make sure that if these tools are used it is in a responsible and equitable way.
  2. Ensure Fairness in Automated Decisions. Computerized decisionmaking in areas such as employment, health, education, and lending must be judged by its impact on real people, must operate fairly for all communities, and in particular must protect the interests of those that are disadvantaged or that have historically been the subject of discrimination. Systems that are blind to the preexisting disparities faced by such communities can easily reach decisions that reinforce existing inequities. Independent review and other remedies may be necessary to assure that a system works fairly.
  3. Preserve Constitutional Principles. Search warrants and other independent oversight of law enforcement are particularly important for communities of color and for religious and ethnic minorities, who often face disproportionate scrutiny. Government databases must not be allowed to undermine core legal protections, including those of privacy and freedom of association.
  4. Enhance Individual Control of Personal Information. Personal information that is known to a corporation — such as the moment-to-moment record of a person’s movements or communications — can easily be used by companies and the government against vulnerable populations, including women, the formerly incarcerated, immigrants, religious minorities, the LGBT community, and young people. Individuals should have meaningful, flexible control over how a corporation gathers data from them, and how it uses and shares that data. Non-public information should not be disclosed to the government without judicial process.
  5. Protect People from Inaccurate Data. Government and corporate databases must allow everyone — including the urban and rural poor, people with disabilities, seniors, and people who lack access to the Internet — to appropriately ensure the accuracy of personal information that is used to make important decisions about them. This requires disclosure of the underlying data, and the right to correct it when inaccurate.

As an example, consider this Chicago crime risk profiling system. Is it worrying? If so, why; if not, why not?