Toll, poll, and tolerance.
The Herald has a story that has something for everyone. On the front page of the website it’s labelled “Support for lower speed limit“, but when you click through it’s actually about the tighter tolerance (4km/h, rather than 10km/h) for infringement notices being used on the existing speed limits.
The story is about a real poll, which found about 2/3 support for the summer trial of tighter speed limits. Unfortunately, the poll seems to have had really badly designed questions. Either that, or the reporting is jumping to unsupportable conclusions:
The poll showed that two-thirds of respondents felt that the policy was fair because it was about safety. Just 29 per cent said that it was unfair and was about raising revenue.
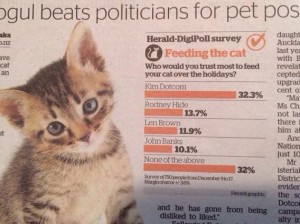
That is, apparently the alternatives given for respondents combined both whether they approved of the policy and what they thought the reason was. That’s a bad idea for two reasons. Firstly, it confuses the respondents, when it’s hard enough getting good information to begin with. Secondly, it pushes them towards an answer. The story is decorated with a bogus clicky poll, which has a better set of questions, but, of course, largely meaningless results.
The story also quotes the Police Minister attributing a 25% lower death toll during the Queen’s Birthday weekends to the tighter tolerance
“That means there is an average of 30 people alive today who can celebrate Christmas who might not otherwise have been,” Mrs Tolley said.
We’ve looked at this claim before. It doesn’t hold up. Firstly, there has been a consistently lower road toll, not just at holiday weekends. And secondly, the Ministry of Transport says that driving too fast for the conditions is a only even one of the contributing factors in 29% of fatal crashes, so getting a 25% reduction in deaths just from tightening the tolerance seems beyond belief. To be fair, the Minister only said the policy “contributed” to the reduction, so even one death prevented would technically count, but that’s not the impression being given.
What’s a bit depressing is that none of the media discussion I’ve seen of the summer campaign has asked what tolerance is actually needed, based on accuracy of speedometers and police speed measurements. And while stories mention that the summer campaign is a trial run to be continued if it is successful, no-one seems to have asked what the evaluation criteria will be and whether they make sense.
(suggested by Nick Iversen)


