Posts from January 2014 (43)

January 31, 2014

Briefly

  • Data journalism and computing. Scott Klein (Nieman Journalism Lab, Harvard): In 2014, you will be scooped by a reporter who knows how to program.  Alexander Howard (Tow Center for Digital Journalism Columbia) If you contrast his approach to commentators who make observations about Twitter without data or much experience, it’s easy to score one for the data journalist


  • Post hoc ergo propter hoc: When the Huffington Post writes about a lottery winner “Perhaps fortune cookies really can predict the future. Or at least William Johnson’s did” you know they don’t really mean you to take the claim seriously, so it isn’t really irresponsible. When Stuff writes, in what’s basically an ad for an alternative medicine book  `taking an alternative approach “was a gamble I was willing to take”, Jess says. It paid off,’ it’s less clear that they know this is bogus.  At least they do mention her mother tried the same thing (for a potentially-curable type of cancer) and died. For ‘balance’ read what a cancer surgeon says about this case.


  • There is no meaningful sense in which the recent fall in the Australian dollar affects the affordability of Auckland houses. The problem is bad enough without this sort of nonsense.
January 29, 2014

Mouthwash hogwash?

The Herald (from the Daily Mail again, sigh) has a story about deadly mouthwash

Using mouthwash is a ‘disaster’ for health, increasing the risk of heart attacks and strokes, scientists are warning

In a small experimental study, 19 people who spent two weeks using a type of mouthwash not recommended for long-term use ended up with slightly higher blood pressure, by 2-3.5mmHg (or ‘mmgh’ as the story says). This was an uncontrolled study and everyone had the with-mouthwash and without-mouthwash experimental periods in the same order, so it could just have been a problem of experimental design, but it’s quite plausible that it’s true, and similar results have been found in the past.

What’s a bit surprising is that the story regards this as entirely a bad thing. The hypothesised reasons for the blood pressure difference is that the mouthwash kills bacteria in the mouth that make nitrite. You probably have heard of nitrite in previous Herald or Daily Mail stories.  It’s usually  described as a preservative for cured meats and is anathematised for its presumed potential to cause cancer. Even the introduction in the mouthwash research paper mentions that nitrite has traditionally been regarded as harmful and doesn’t give any of the recent evidence to the contrary.

There is also a widespread belief, though based on relatively weak evidence, that gum and mouth infections increase the risk of heart disease. Since the type of mouthwash being studied is recommended only for treatment, not for long-term use, it might easily decrease rather than increase the risk of heart disease if used as recommended.

It’s not obvious whether the benefits of mouthwash for chronic disease would outweigh the disadvantages, even if the research had studied the sorts of mouthwash (such as Listerine) intended for daily use. It is clear that the context, even context present in the abstract of the open-access research paper, is being ignored.

Using statistics to fight crime

“I want to ‘Money Ball’ criminal justice” – Anne Milgram

Fascinating video from TED.

“When she became the attorney general of New Jersey in 2007, Anne Milgram quickly discovered a few startling facts: not only did her team not really know who they were putting in jail, but they had no way of understanding if their decisions were actually making the public safer. And so began her ongoing, inspirational quest to bring data analytics and statistical analysis to the US criminal justice system.

Anne Milgram is committed to using data and analytics to fight crime.”

January 25, 2014

When do we care about international comparisons?

I’ve done a bunch of posts recently about international comparisons. A good way to get a headline is to say NZ is the worst (second-worst, third-worst) in the world.  These tend not to be true — what’s usually true is that NZ is the worst among a smaller group of countries with high-quality official statistics.

But when do we even care? I’ll look at three recent examples

  • NZ is the worst (only not) in bowel cancer rates, so we need subsidised screening
  • NZ is the third worst (only probably not) in child road deaths, so we need to require child car seats up to age 11.
  • NZ is the second worst (only not) in imprisonment rates, so we need to change the justice system

When deciding whether to subsidise bowel cancer tests there are just two things that matter: whether it works, and how much it costs. If the screening isn’t effective, we shouldn’t do it. If it is effective, but costs a lot more than other ways of preventing the same amount suffering and loss of life, we should do those instead. It doesn’t matter whether the rates are higher in Austria or Australia. No-one should be taking that into account.

When deciding whether to require child car seats, there are three things that matter: do they prevent injuries, how much do they cost to buy, and how much does the law cost in enforcement and in the (subjective but real) costs of forcing people to do things. If the seats don’t prevent injuries, we shouldn’t use them. If they don’t prevent more injuries than other things we could do at a similar price, we should consider those things first. And to make them compulsory, the benefit has to be large enough to be worth the monetary and non-monetary costs of enforcement, but not large enough that parents will do it voluntarily. If we can satisfy these criteria, we should pass the law, regardless of what is happening in other countries. If we can’t satisfy these criteria, we shouldn’t.

Imprisonment rates are a bit different. It’s not obvious what the ‘right’ imprisonment rate is, so international comparisons are actually helpful in deciding whether the NZ rate is high or low. Comparisons to the whole world are still pointless, but it makes sense to compare to other countries with basically similar legal systems and a fairly high level of trust in government.

Even when we shouldn’t care about what is being done in other countries, it’s often useful to know why they do what they do. That’s why I link to things like the US Preventive Services Taskforce recommendations. It’s not that New Zealand should necessarily do what the US does, but the PTF has more resources for making decision, and they show their working. We can look at their collected evidence and read their rationales, and that’s helpful in deciding what to do in New Zealand.

Briefly

  • Warren Buffett is offering a prize of a billion dollars for correctly predicting all 63 US college Division 1 basketball games. Corey Chivers analyses the odds, and summarises as “You’re not going to win, but you’re still going to play.”  (via Jie Fu Yu)
  • According to the Herald, nearly one in three people (28%) admitted to the emergency room on Saturday nights had been drinking. According to the NZ Alcohol and Drug Use Survey 26% of people in New Zealand drink more than twice a week, and it would be deeply unsurprising if Saturday was one of those nights. The real statistic is that 80% of those had been drinking heavily: that’s just over 20%, almost twice the proportion of people who report drinking heavily at least once a week. There is an increased risk, but less than the story implies.
  • Some researchers at Princeton have modelled Facebook as an epidemic (PDF preprint), and predict that 80% of people will recover by 2017. I’m not convinced — they aren’t modelling the heterogeneity in Facebook users, and I think the older users will hang on longer. [Update: Mike Devlin uses web and social media data to show that Princeton will also disappear]


January 24, 2014

Citation needed

From Stuff, in a story about the new child-seat law not being broad enough

New Zealand has the third-highest child road death toll in the OECD, [a group of paediatric specialists] say in this month’s New Zealand Medical Journal.

This group are arguing for child restraints up to age 11, rather than age 7. As you know, I’m skeptical about claims like ‘third-highest’, so I looked at the NZ Medical Journal article. Its claim isn’t as strong

New Zealand compares unfavourably to other OECD countries for child traffic crash-related trauma[2]

And reference 2 is

  1. New Zealand Transport Agency. Child Restraints Fact Sheet 07. Wellington: New Zealand Transport Agency, 2012

which, as you can see for yourself, doesn’t say anything at all about OECD comparisons. Presumably that’s just an editing error in the NZMJ paper, but as far as I can tell, none of the other references were OECD documents either.

The closest thing to OECD statistics I can find on the internets is this 2004 report, based on data from 1996-2000. It does show NZ third out of the set of countries with good enough data to be in the table, so I suspect it’s the source of the statistic. It’s a bit out of date, is nowhere near all of the current OECD, and is for all children 0-14, when the story is about needing child restraints for children 7-11.

The NZ data in the NZMJ article are more up-to-date (2000-2009), but are only for infants 0-4, who have been required to been in proper child seats for the last twenty years, so those data are irrelevant to the point being made.

So in this case the ‘3rd worse’ statistic is true(ish), but you can’t find it where Stuff attributes it, and you can’t find it where the NZMJ paper attributes it. And it’s based on data from a time when the overall NZ road toll (per capita) was twice what it is now, and the number of deaths in children under 14 was three times what it is now.

It’s a good thing the statistic isn’t really relevant to the campaign.


[update: in comments, Glen Koorey has found up-to-date information. New Zealand is currently 10th out of 29 countries in 0-14 road deaths]

January 23, 2014

Really the worst?

Stuff has a story saying NZ is the worst in the world for bowel cancer, according to new World Health Organisation statistics. We’ve looked recently at claims that NZ was 2nd worst and 3rd worst in the world on various measures. They weren’t true. This one isn’t true either, though as with the previous stories, the truth is that NZ is still pretty bad.

The Herald story is more accurate, saying that Australia and New Zealand are the highest; that’s still a bit misleading because it just means the highest among regions, not countries, and because the region is dominated by the Australian data.

Since the stories are calling for more screening, it doesn’t really make sense to look at rates of diagnosis (‘incidence’). Incidence rates can only go up with increased screening, not down — the whole point of screening is to increase diagnosis. It makes more sense to looks at rates of death from bowel cancer (though the claims aren’t actually true for incidence, either).

If we use the new World Health Organisation statistics that both stories mention, and compare deaths from bowel cancer (as a fraction of the whole population, standardised for age) to all the countries for which the World Health Organisation has data, we find that NZ is second-worst in women (the gray line) and the rate of death is almost twice that for Australia.

female-mortality

In men, New Zealand is 25th-worst, and about 50% higher than Australia

male-mortality

Going for the ‘worst in the world’ title has led to missing a real public-health fact from the new statistics: NZ fatal bowel cancer rates compare much less favorably in women than in men, whether the comparison is to the whole world or to Australia.

But probably not.

From the Herald: “Herbs, berries and red wine could create diabetes barrier

High intakes of the flavonoids are linked to lower insulin resistance and better control of blood sugar, a study has shown.

Both effects help stave off the onset of Type 2 diabetes

That’s better than the Daily Mail lead

It sounds like the ingredient list for an indulgent dessert. But red wine, chocolate and strawberries are more than a guilty pleasure. They could all help guard against diabetes.

But it’s still misleading.  The study (newspapers,would it kill you to link?) didn’t measure diabetes in anyone, just an estimate of insulin resistance.

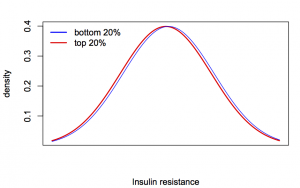
More importantly, the difference is tiny. No, smaller than that. The difference in the insulin resistance estimate between the 20% of participants with the highest and lowest flavanoids in the diet was 0.1. The standard deviation of insulin resistance was 1.6. For people who aren’t as used to visualising this sort of difference, this is what it would look like if they were Normal distributions

bluered


As usual, the StatsChat advice is that there are good reasons to consume red wine and chocolate, but preventing diabetes is not one of them.

Onward and upward

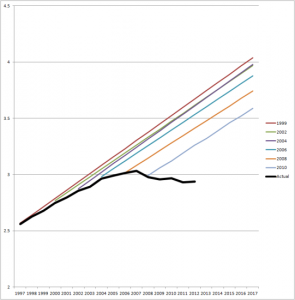
This graph (from Clark Williams-Derry via Andrew Gelman) shows US national traffic forecasts over time (the straight lines) and the reality (the black line)

VMT-C-P-chart-big1-541x550


Initially, the straight-line extrapolation would have made sense, but for the past five years or so it’s been increasingly obvious that it’s bogus.   Some of the fall off from expectations is due to the US recession, but people in the US seem to just be driving less than forecast.

It would be interesting to see this sort of graph for NZ data.

January 21, 2014

Meet Jonathan Goodman, Statistics summer scholar

Every year, the Department of Statistics at the University of Auckland offers summer scholarships to a number of students so they can work with our staff on real-world projects. Jonathan Goodman is working with Associate Professor Brian McArdle on a project called A comparison of multivariate dispersion tests. Jonathan explains:

“The assumption of homoscedasticity, that the groups we are going to compare have the same level of spread, is one of the fundamental assumptions made when doing analysis of variance. My research is looking at the range of tests of equality of variance.   Jonathan Goodman

“Brian has developed a technique that enables us to take tests developed to examine the levels of variance in a single variable and apply them to multivariate data. The aim of my research is to examine the personality of a range of tests in the univariate domain: are they Liberal or Conservative? Do they need lots of data and can they handle lots of groups at once? I will then take the univariate tests, and using Brian’s technique, see how they work with multivariate data.

“Over the past three years, I’ve been using techniques without looking at the machinery behind them. Now I get to break them open, see which work best and where, and perhaps give back to the stats community by helping to optimise the techniques.

“I have just completed my BSc majoring in Statistics and Psychology and next I will be doing my Honours degree in Statistics.

“Statistics is the best subject to study because it gives one the tools to answer questions asked in every subject. I’ve worked with people looking at the feelings of petrol station reps; the attitudes and values of New Zealanders; the effect of the stiffness of the pelvic floor on post-natal pelvic organ disorders; and the effects of different stent designs on aortal blood flow.”