Posts from December 2013 (51)

December 9, 2013

Muphry’s Law

Muphry’s Law says that any attempt to criticise editing or proofreading will contain editing or proofreading errors. It clearly extends to criticising educational standards:

The biggest fall in NZ’s rankings was in mathematics, from 13th to 23rd (though we also fell from 7th to 18th in science and from seventh to 13th in reading).

(via @economissive)

Inequality in NZ

Nick Iversen nominated the Herald’s story on increasing inequality as Stat of the Week, on the grounds that it didn’t have any data showing increasing inequality. That’s slightly unfair — the increase in high incomes is not explainable by inflation — but it’s certainly true that the conclusion was pretty weakly supported by the numbers.

Firstly, any comparison of money in 2006 to money in 2013 that’s not inflation-adjusted in some way is pretty pointless. The CPI went up 19% over that period.

Secondly, minimum wages are pretty obviously relevant. At the last Census, the minimum wage was $9.50; at this Census it was $13.50, a nominal increase of 42% and a real increase of  19%.

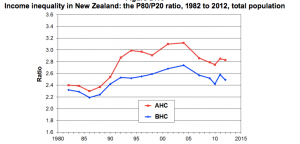
Thirdly, there are established ways to measure income inequality, and while they aren’t perfect, they are better than trying to reinvent the wheel.  From an Inequality Forum earlier this year,  we can find some summaries based on survey data (PDF) of the ratio of the 80th to 20th percentile of income, and the Gini index.  Here’s the 80:20 ratio, with the blue line for income before subtracting housing costs and the red line for income after subtracting housing costs. Both have gone down since 2006, though up since the 1980s, and housing costs are clearly a fair chunk of the inequality problem.

r8020


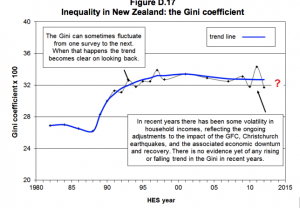
The Gini index is a more complicated summary of inequality that uses all the data, not just two percentiles. It’s popular for comparing between times and between countries.  The Gini index for raw income (before taxes and benefits) has stayed fairly stable in NZ recently.

gini


The Gini index for income after taxes and benefits will have increased, but probably not by a lot.

So, inequality in NZ is substantially higher than it used to be, and there are a lot of reasons to think this is bad, but the increase was in the 1980s and 1990s, not since 2006.  And this information is not hard to find.

December 6, 2013

If New Zealand were a village of 100 people ….

… according to the 2013 Census figures,

  • 51 would be female, 49 male.
  • 70 would be European, 14 Maori and 11 Asian.
  • 24 would have been born overseas
  • 21 would have a tertiary qualification
  • 4 would be unemployed.
  • 4 would earn over $100,000

Statistics New Zealand has done a nice graphic of the above, too. Full 2013 Census info available here.


Reports about young women and binge-drinking: a caution

Local media have been proclaiming that younger women are binge-drinking themselves into oblivion, (examples here and here),  many of these stories leaning on Canadian journalist and recovering alcoholic Ann Dowsett Johnston’s book Drink: The Intimate Relationship Between Women and Alcohol.  She says the percentage of college students who binge drink, using the measure of consuming five or more drinks in one sitting, was nearly 45% in 2011, and repeated this in a recent Wall Street Journal item called The New Face of Risky Drinking is Female.

However, there is an editor’s note at the bottom of her piece (that probably should be at the top), pointing out that Johnston got her compelling  figure by combining the results  of two separate studies carried out in different years.

The  non-profit, non-partisan Statistical Assessment Service (STATS) in the US points out that a basic tenet of Statistics 101 is that one should never directly compare survey results that come from different populations or that were provided from surveys taken with different methods, even if the surveys are angling for the same kind of data.  Surveys can return different results for a variety of reasons, from the time of year in which they are administered, to the population from which participants are chosen, and even to how the questions are asked. In this case, it says, both surveys  have systematic biases that come from their survey methods, which in turn makes direct comparisons problematic. See its useful analysis of the situation here.


December 5, 2013

Anybody for a slice of PISA?

There has been significant coverage in the press of New Zealand’s slip in the OECD PISA (Programme for International Student Assessment) rankings for mathematics, reading, and science.
We probably should be concerned.

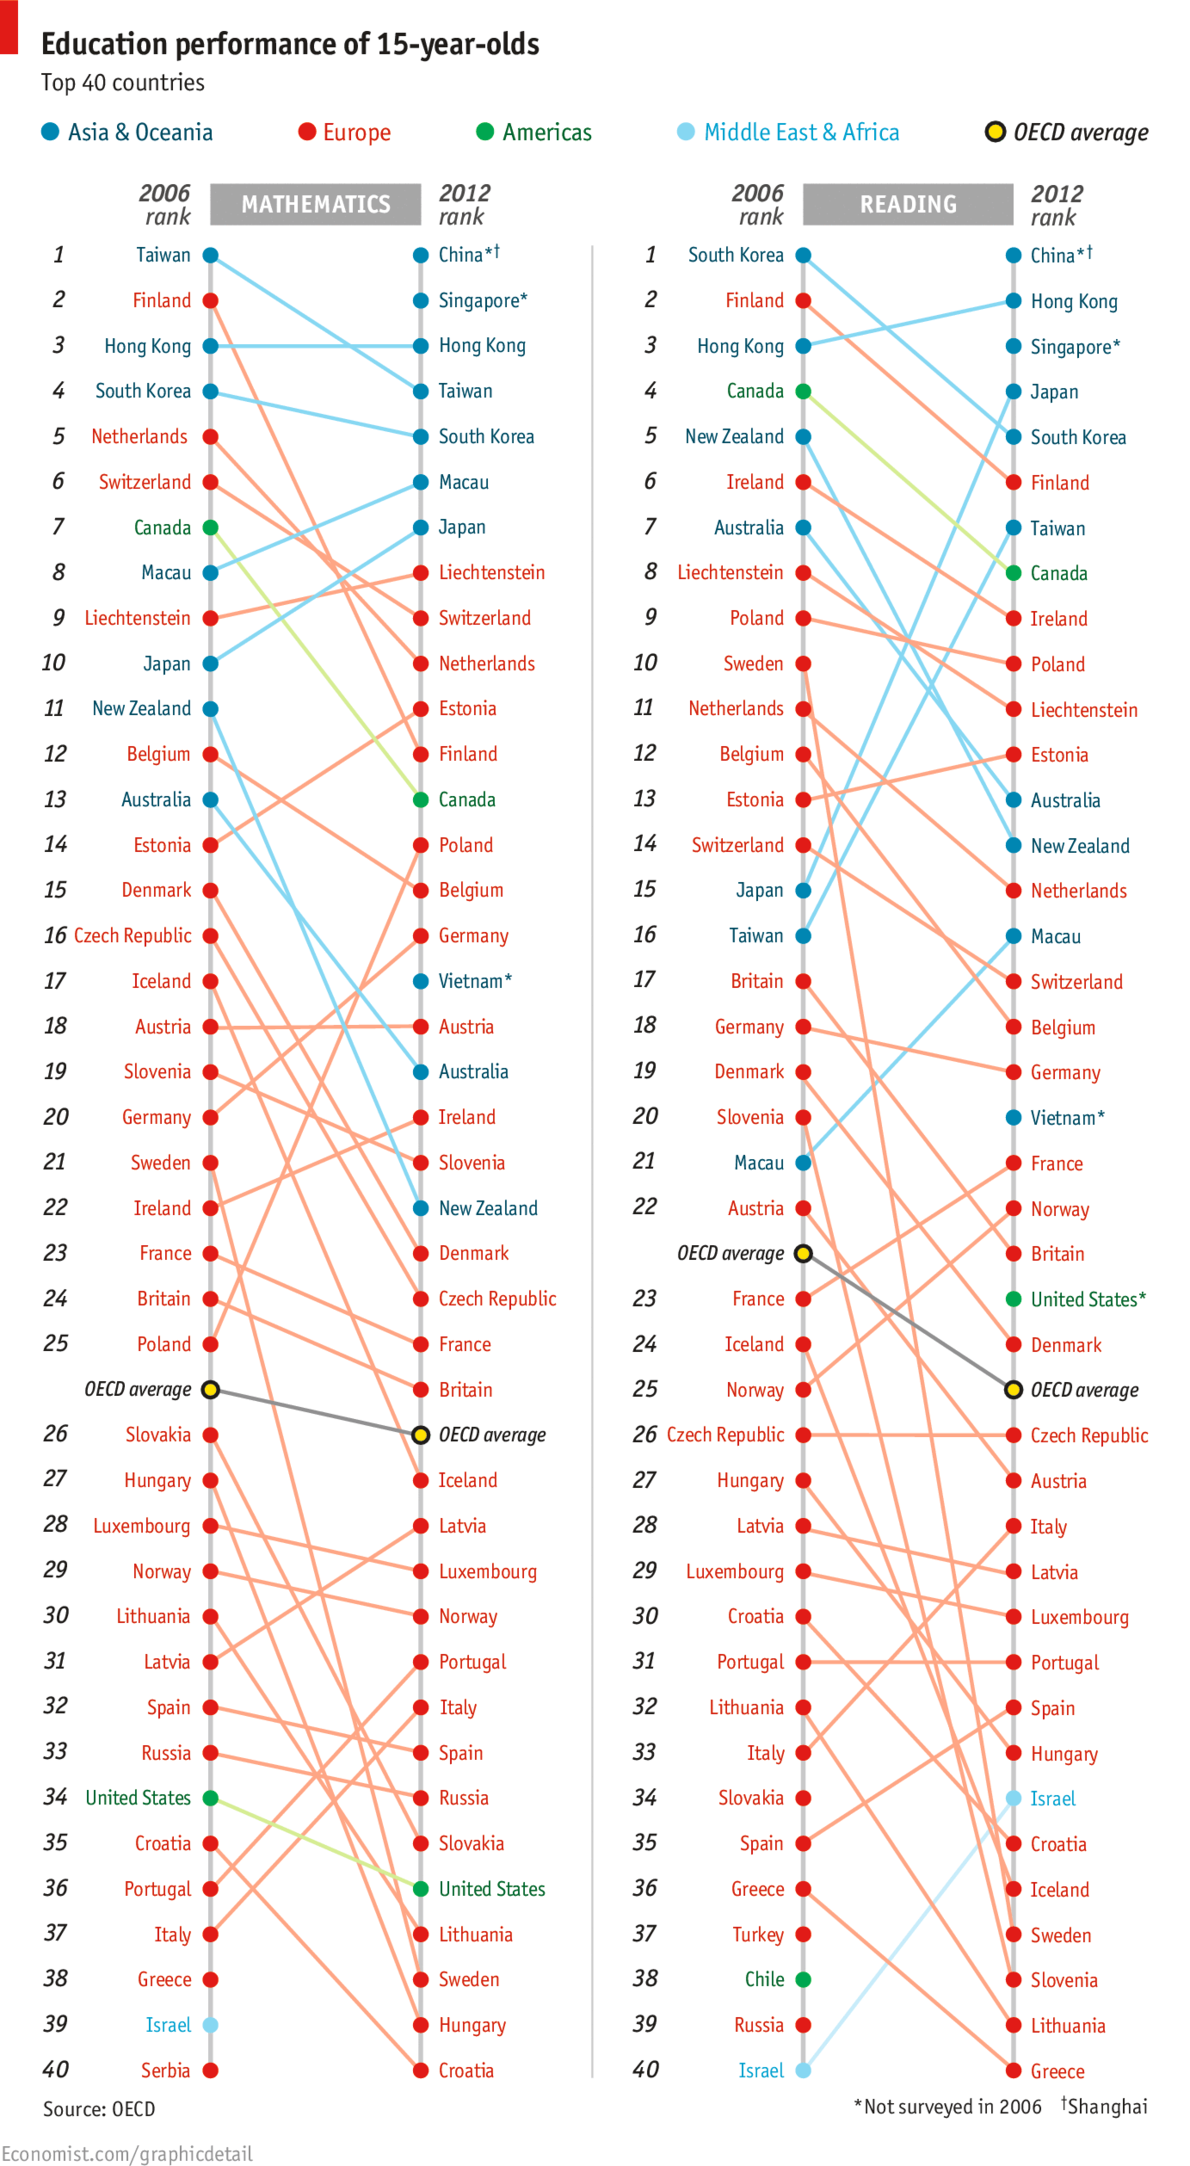
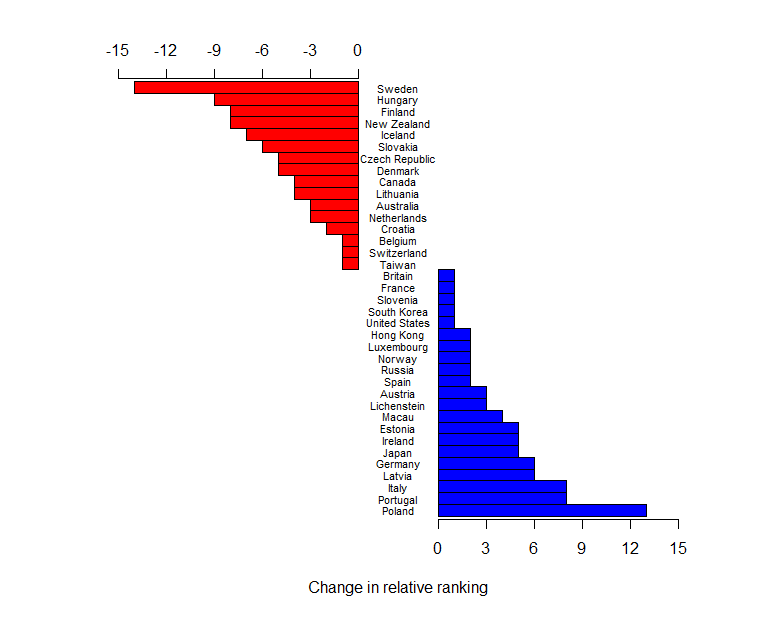
However, today I stumbled across the following chart: OECD PISA Rankings 2006 and 2012 in The Economist. Two things about it struck me. Firstly, part of the change (in the mathematics ranking at least) was driven by the addition of three countries/cities which did not participate in the 2006 round: Shanghai, Singapore, and Vietnam. The insertion of these countries is not enough to explain away New Zealand’s apparent drop, but it does move us from a change of down 11 places to a change of down 8 places. Secondly, I found it really hard to see what was going on in this graph. The colour coding does not help, because it reflects geographic location and the data is not grouped on this variable. Most of the emphasis is probably initially on the current ranking which one can easily see by just reading the right-hand ranked list from The Economist’s graphic. However, relative change is less easily discerned. It seems sensible, to me at least, to have a nice graphic that shows the changes as well. So here it is, again just for the mathematics ranking: Changes in PISA rankings for mathematics.

The raw data (entered by me from the graph) has been re-ranked omitting Greece, Israel, and Serbia who did not participate in 2012, and China, Singapore, and Vietnam, who did not participate in 2006. I am happy to supply the R script to anyone who wants to change the spacing – I have run out of interest.

It is also worth noting that these rankings are done on mean scores of samples of pupils. PISA’s own reports have groups of populations that cannot be declared statistically significantly different (if you like to believe in such tests). This may also change the rankings.

Updates:

Professor Neville Davies, Director of the Royal Statistical Society’s Centre for Statistical Education, and Elliot Lawes, kindly sent me the following links:

Firstly a blog article from the ever-thoughtful Professor David Spiegelhalter: The problems with PISA statistical methods

and secondly, a couple of articles from the Listener, which I believe Julie Middleton has also mentioned in the comments:
Education rankings “flawed” by Catherine Woulfe” and Q&A with Andreas Schieicher also by Catherine Woulfe.

My head hurts. I need my 61st cup of coffee.

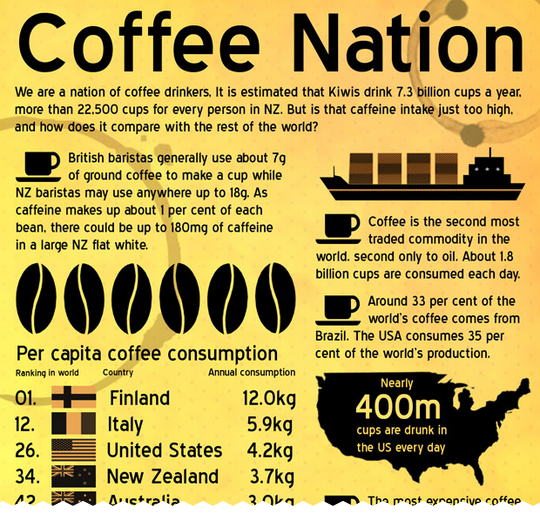
I was sent a link by Whale Oil to this “awesome” infographic over on the NZ Herald:

coffee-infographic

For a while, I just couldn’t figure out how on earth they calculated that Kiwis each drink an average of 22,500 cups a year, which equates to over 61 cups of coffee a day!

The 3.7kg of coffee a year figure in the infographic comes from Wikipedia.

However, if you Google “coffee facts New Zealand”, the third result is this page which contains those figures of 7.3 billion cups of year and 22,500 cups per person. The page appears to have been written back in 2009. I guess this is how research is done these days.

Update: The infographic has been edited to remove those figures.

December 3, 2013

Silliness on both sides in the Waikato fluoride stoush

The anti-fluoride Fluoride Action Network has accused the Waikato Times of reversing the results of an online poll that asked whether people supported the council’s move to defer re-fluoridating the city’s water supply until a High Court legal challenge  is decided.

What the Waikato Times did or didn’t do is immaterial. Folks, the paper ran a self-selecting online poll, which makes its results utterly meaningless.

The best poll we have on this is October’s non-binding referendum. It showed that nearly 70% of Hamilton voters favoured water fluoridation.

December 2, 2013

Good graph/bad graph

  • The Herald has a nice display of how the percentage of first-home buyers varies across Auckland. I think (though the text could be clearer) that this is data since the start of 2012. I don’t know exactly how they define first-home buyers: quite a few immigrants, like me, will have been home owners outside NZ before buying a home here.
  • From wtfiz.net, originally a section of an infographic from graphs.net pyramid

To start with, the noseless guy doesn’t cast a shadow, although the almighty dollar he is holding casts a shadow on the empty air. Perhaps he’s a vampire. Also, the colours in the legend don’t actually match the colours in the graph. And, the graph manages to misrepresent not only the magnitude of the numbers but even their ordering, with the largest layer of the pyramid representing the smallest category.  To top it all off, the numbers aren’t even right (or are seriously outdated) — for example, the US Bureau of Labor Statistics Consumer Expenditure Survey reports food expenditure between 12.5% and 13% of  household expenditure every year from 2006 to 2012, not the 15% in the graph

Don’t be scared of WiFi

From TV One Breakfast this morning “WiFi detrimental to health, study suggests“. (I didn’t see this live; the Science Media Centre contacted me for comment)

The guest, Mr Kasper from Safe Wireless Technology NZ, said

Overseas research has shown that a person who uses a mobile phone for a year increases their chances of getting brain cancer by 70%, according to the SWTNZ.

The ‘overseas research’ appears to be this, a case-control study of acoustic neuroma in Scandinavia. The first thing to note is that “acoustic neuroma” isn’t the same thing as “brain cancer”. Acoustic neuroma is a rare, benign brain tumour (‘benign’ means it doesn’t spread metastatically), which is usually treatable, though often with long-term effects.  The researchers didn’t suggest that their results applied to other brain tumours; in fact, they assumed the opposite and used people with a different brain tumour, meningioma, as one set of controls for their comparisons.

The story  also says

“There’s so much research and there’s so much scientific evidence now that does more than just suggest that there is a real problem, and people are getting these problems,” Mr Kasper said.

The National Cancer Institute has a good summary of the scientific evidence, and they are not at all convinced. It certainly isn’t the case that there’s a strong association with brain cancer overall.

The new research appears to be better conducted than a lot of the past claims of associations between radio waves and health. It’s working against a strong burden of proof both from animal studies and from the fact that radio waves can’t damage DNA. I don’t think it manages that level of proof, but I think reasonable people could disagree. However, even if we assume that the association specifically with acoustic neuroma is real and causal, it doesn’t really support any concern over WiFi. Cellphones are pressed up against the ear, and so provide higher dose of radio-frequency energy to that ear. WiFi transmitters are typically not pressed up against the ear, and each doubling of the distance reduces the energy by a factor of four. And, since they don’t have to reach as far, WiFi signals are less powerful to begin with.

The story ends with

“We do want the Government to put some money into some independent research.”

I’m generally in favour of the Government putting money into research, but on this particular topic  there’s no real advantage to the research being done in New Zealand, and we have too small a population to contribute much. There are large international studies ongoing; we don’t need a small local one.

If you are worried about cellphones and acoustic neuroma, use headphones with your cellphone. If you are worried about WiFi and brain cancer, then relax.
 

Stat of the Week Competition: November 30 – December 6 2013

Each week, we would like to invite readers of Stats Chat to submit nominations for our Stat of the Week competition and be in with the chance to win an iTunes voucher.

Here’s how it works:

  • Anyone may add a comment on this post to nominate their Stat of the Week candidate before midday Friday December 6 2013.
  • Statistics can be bad, exemplary or fascinating.
  • The statistic must be in the NZ media during the period of November 30 – December 6 2013 inclusive.
  • Quote the statistic, when and where it was published and tell us why it should be our Stat of the Week.

Next Monday at midday we’ll announce the winner of this week’s Stat of the Week competition, and start a new one.

(more…)