Posts from November 2013 (53)

November 25, 2013

Stat of the Week Competition: November 23 – 29 2013

Each week, we would like to invite readers of Stats Chat to submit nominations for our Stat of the Week competition and be in with the chance to win an iTunes voucher.

Here’s how it works:

  • Anyone may add a comment on this post to nominate their Stat of the Week candidate before midday Friday November 29 2013.
  • Statistics can be bad, exemplary or fascinating.
  • The statistic must be in the NZ media during the period of November 23 – 29 2013 inclusive.
  • Quote the statistic, when and where it was published and tell us why it should be our Stat of the Week.

Next Monday at midday we’ll announce the winner of this week’s Stat of the Week competition, and start a new one.

(more…)

Stat of the Week Competition Discussion: November 23 – 29 2013

If you’d like to comment on or debate any of this week’s Stat of the Week nominations, please do so below!

November 24, 2013

Measuring the right variable

superbowl


And, of course, New Zealand won the Rugby world cup, NZ or Australia will win the League world cup next weekend, and NZ was the only undefeated team in the last soccer World Cup, so Europe’s overall football credentials seem to be on shaky ground.  At least if you set up the comparison very, very carefully.

Generalisations of this approach to unsupported nutritional advertisting, surrogate outcomes in clinical trials, ranking of universities, and the claim that people with incomes below $110,000 collective pay no net income tax provide a lot of the work  for StatsChat.

(via Ben Atkinson on Twitter. I can’t identify the original source, but this version has the best punctuation.)


Blood alcohol change report

The detailed Ministry of Transport paper on changing the legal blood alcohol limit is now available.  There’s a story in Stuff, which is, if anything, unduly critical (an interesting change). It doesn’t mention the cost-benefit analysis, and implies a fines grab

Transport officials calculate nearly 20,000 people will be caught by the lower drink-driving limit – earning the Government $5 million extra in fines. 

which is a bit misleading since the report (paragraph 93) actually estimates a net increase in costs to the justice system of about $2 million in the first year and about half a million in subsequent years, ie, the fines don’t cover the costs of enforcing the change.

Basically, whether the change is a benefit or not depends on how much inconvenience and risk is caused to the average driver, the only major component that isn’t taken into account in the calculations.  If this is worth only 50c/month or so, the policy makes sense. If it’s worth a few dollars a month, not.

On the other hand, the policy is popular, and since most people should have a reasonable appreciation for how the change will affect them personally, that’s a more persuasive argument than it would ordinarily be.

November 23, 2013

Official statistics

Government statistics of an unusual kind, from CNTV, via Blood & Treasure

They’re local officials from remote Qingshuihe County in Xinjiang Uyghur Autonomous Region who don’t have time to even blink as they each count about 10,000 sheep a day. They’re here to make sure there’s never gridlock on the sheep highway through the river valley and the pastures aren’t grazed bald.


November 22, 2013

Briefly

November 21, 2013

Compared to whom?

The members of the Organisation for Economic Cooperation and Development (OECD) are a popular reference set when comparing NZ performance.  Or at least, they used to be. The OECD has expanded over the decades since it was formed, and not everyone’s referencing has kept up.

Yesterday, I wrote about imprisonment rates. Today, a (mostly good) Dominion Post editorial about sex education said

New Zealand has the third highest teen pregnancy rate among OECD countries.

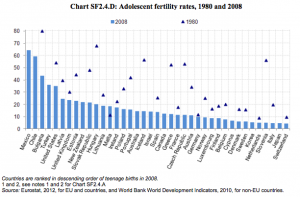
In fact, the OECD said last year (their most recent report, PDF) that NZ has the ninth highest teen pregnancy rate among OECD countries:

oecd

It is third-highest among countries that joined the OECD before 1990, but that’s starting to look less like a natural comparison.

The other point the graph makes is that teenage pregnancy is less common than it used to be, essentially everywhere where there is data. The editorial argues that the internet has made alternatives to proper sex education worse than they used to be.  That’s a reasonable position on some important issues, but it clearly doesn’t apply to teen pregnancy, and it would be nice to see this admitted more often.


November 20, 2013

We’re not number two.

From Stuff

New Zealand had the second highest imprisonment rate in the world, with an overrepresentation and disproportionate rate of Maori prisoners. “This has attracted comment from the United Nations and overseas media.”

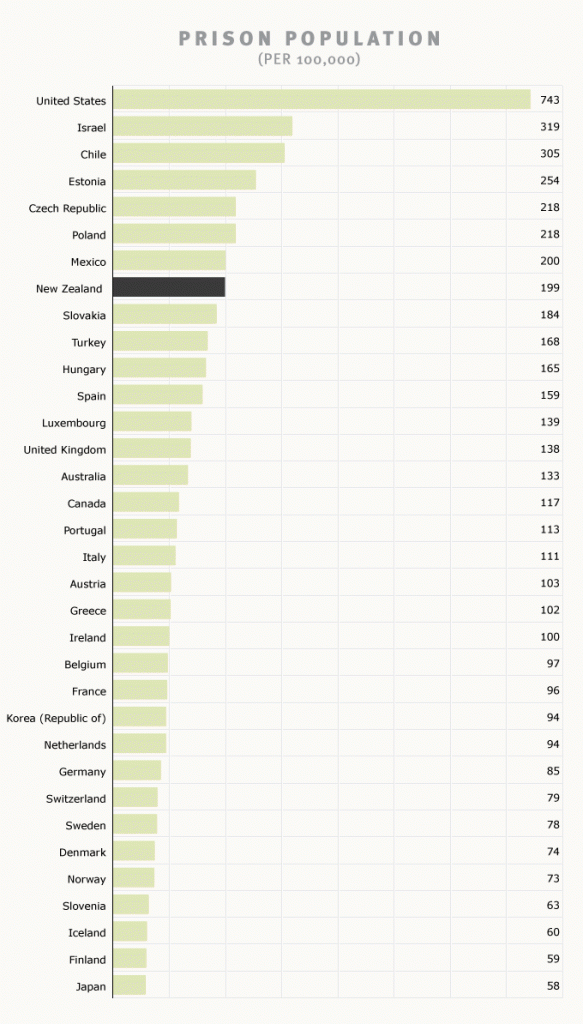
This is half right. There is certainly serious overrepresentation of Maori in the prison population. However, New Zealand doesn’t have the second highest imprisonment rate in the world. Or even in the OECD. And it’s not hard to find this out.

The Encyclopedia of New Zealand, Te Ara,  gives this graph, dated May 2011, for OECD countries, referencing the International Center for Prison Studies (PDF)

prison

Wikipedia has NZ in 74th place for all countries, referencing the same source, behind most of the Caribbean, much of the former Eastern Bloc, and Samoa. So, whether you’re going for easily accessible online references like Wikipedia and Te Ara or actual expert data curation, you get the same results.

New Zealand’s imprisonment rate is too high. I don’t see a good reason why it should be much higher than, say, Australia or the less wealthy Western European countries. But it’s not second in the world by any reasonable definition of “the world”.

(Update: Graeme Edgeler wrote about another airing of this recently, which I had thought I remembered, but couldn’t find when writing this.)

Statistician statistics: gender, race, ethnicity

New data from the American Community Survey on race, ethnicity, and gender balance in science/technology employment.  (more…)

What do statisticians do all day?

The annual posting of our second-semester MSc and Honours project topics, which were handed in this week.

  • Modelling paua (abalone) growth and investigating seasonal patterns of growth in relation to temperature and genetic family
  • Investigating spatial and temporal patterns in trawl survey time series
  • Identification of spatial and temporal patterns in, and the factors affecting New Zealand fishery catch composition
  • Are newspaper health stories reproducible?
  • Evaluating computer generated designs
  • Model selection methods for supersaturated designs
  • Bayesian Estimation of Undetectable Reverberation Lags
  • Interactive web graphics using widgets and gridSVG
  • Producing HTML Tables with the xtable Package
  • Software for Time Series of Counts
  • Prediction of Super 15 and NRL games
  • Optimal portfolio rebalancing strategies
  • Creating synthetic census datasets using multiple imputation
  • Sustainable Spending in retirement
  • Predictors of on-road particle concentrations
  • Geographic and other sources of variation in the normal range of echocardiographic measurement of the heart
  • Modelling air quality extremes
  • Confidence Regions for Categorical Data
  • Clustering Populations using short tandem repeats
  • Are invariant sites really necessary in phylogenetic inference?
  • Working Likelihood Test
  • Meta analysis of smoking cessation trials
  • Searching for significant differential rules
  • On the use of sequentially normalized maximum likelihood for selecting the order of autoregressions when the model parameters are estimated by forgetting factor least-squares algorithms
  • Connections between the coalescent and birth-death sampling processes