Posts from September 2013 (69)

September 12, 2013

Rape survey

The Herald had a story on Tuesday about a UN survey of men in nine areas in Asia/Oceania asking about rape and violence against women.  The story is pretty good, and actually has links to the articles in the medical journal Lancet.

Because of the wide publicity and the large scale of the survey I think it’s worth nailing down some of the details to make it harder to dismiss.  (more…)

September 11, 2013

Lottery calculations

Even so often, one of the NZ lottery jackpots gets to be unusually large and we see an increasing stream of search engine hits from people looking for ways to win.

Via @mapcaptenor, here’s an analysis of the USA’s Powerball lottery, with the conclusion

The one sentence takeaway: no matter how big the jackpot gets, you should only buy Powerball tickets for their entertainment value.

In fact, an economics argument can get you this conclusion much more easily. All the facts you have about the lottery are available to pretty much anyone in the country, as is the opportunity to buy tickets. Unless you think you are one of the top handful of smartest investors in New Zealand, you should assume that other people will draw the same conclusion as you about whether it’s worth buying tickets. If you think it’s worth buying, so will quite a lot of other people, and collectively you’ll buy up enough tickets to ensure that the expected benefit falls to nearly zero.


Was Göring a good father?

The Herald, like many other news sources worldwide, has picked up on a paper in the Proceedings of the National Academy of Sciences. Like the other glamorous top science journals, PNAS publishes some top-level science, and also some that is perhaps not quite up to the standard.

The story says that men with smaller testicles make better fathers, based on a fairly weak correlation in a relatively small sample of new fathers. As Dr Isis points out, this sample only included 9 dads who did more childcare than the mothers.

If you look at the paper (which you can’t, unless you have a subscription), you find that there was a moderately strong relationship between testosterone levels in the blood and the ‘parenting quality’ questionnaire. When the researchers compared men with similar levels of testosterone and similar working hours, there was no correlation between testicle size and parenting, but if testosterone and hours at work were ignored there was fairly weak evidence of a correlation between testicle size and parenting.  (The researchers presented their evidence using p-values, with p=0.08 , not up to usual standards. I think it would be unconvincing with other ways of measuring evidence as well)

The Discussion section of the paper starts out

Collectively, these data provide the most direct support to date that the biology of human males reflects a trade-off between mating and parenting effort.  

which is, apparently unintentionally,  a pretty damning criticism.

Oh, the post title? Anyone old and British should be able to explain it

New Zealand women in public life, by the numbers


Statistics New Zealand is marking 120 years of women’s suffrage with a nice little infograph (click to enlarge).


The graphics are a recent development, and long may they continue (and that the print media and teachers make the most of them). The last SNZ graphic I saw marked the birth of a certain baby called George, and looked at a range of facts and figures to do with child-rearing in New Zealand.


Some stats talks

If you’re in Palmerston Nth, next Tuesday 17th, James Curran is talking as part of the Royal Society’s 10×10 series of maths presentations around the country

Advances in science have allowed forensic practitioners to recover and quantify evidence from crime scenes in more ways than ever before. As a consequence, judges, lawyers, and juries struggle to decide or understand what the value of scientific evidence might be, and how it impacts on the case at hand. This talk will look at how statistics is being used to aid in the legal process.

And if you’re in Auckland on October 1, I’m presenting at Nerdnite again, (6:30 for 7pm, Nectar bar, above the Kingslander)

“The game of rock, paper, scissors was known in Asia millennia ago. At about the time of Captain Cook, a French political scientist discovered that it isn’t always possible to construct an ordering by considering things two at a time.  In the 1970s a statistician showed how to cheat at dice using this idea. The implications for experiments with a treatment group and a control group are still underappreciated.”


Cumulative totals tend to increase

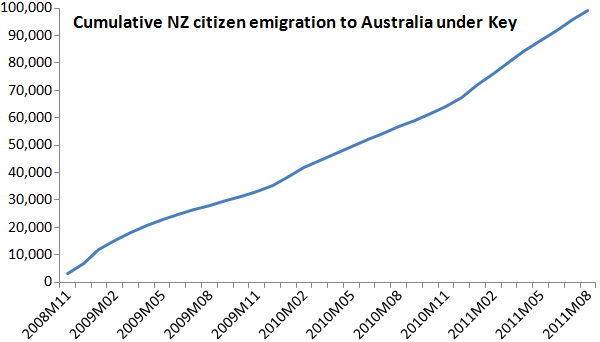
One of our early Stat-of-the-Week awards was for this graph from The Standard

Among the problems is that the graph is cumulative, so it unavoidably goes up.  It’s a good choice if you want the impression of a relentless increase regardless of the data; not so good if you’re trying to inform.

Tim Cook, of Apple, did something similar with iPhone sales at the product release yesterday

iphone-sales

David Yanofsky, at Quartz, overlays the quarterly sales reports

iphone-quarterly


It’s clear that quarterly sales have been declining recently, although it’s also clear that each new iPhone leads to a sales surge.  The quarterly reports actually tell you something about the sales pattern; the cumulative reports really don’t.

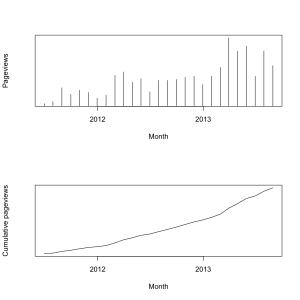
In the same way, although these two graphs of StatsChat page views contain the same information, the first one lets you see  patterns over time, such as the start of the rugby-prediction season, and the times I’m away. Cumulative charts are usually less useful and often misleading, whether deliberately or not.

pageviews

Where’s my tram

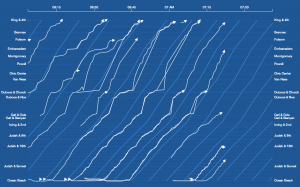
A live visualisation of  locations for a light-rail system in San Francisco. The diagonal lines show the timetable schedule, so you can see speed as well as lateness

sfbus


Something like this for Auckland buses would be neat, but, sadly, the bus location data are secret.

September 10, 2013

ITM Cup Predictions for Round 5

I have now been able to assemble the data for predicting the ITM Cup. The success figures stated below are what would have been achieved had I started predicting in Round 1. The parameters for this season’s predictions were chosen without considering any results from this year and the method is purely algorithmic once the parameters have been chosen.

Team Ratings for Round 5

Here are the team ratings prior to Round 5, along with the ratings at the start of the season. I have created a brief description of the method I use for predicting rugby games. Go to my Department home page to see this.

Here are the team ratings prior to this week’s games, along with the ratings at the start of the season.

Current Rating Rating at Season Start Difference
Canterbury 24.16 23.14 1.00
Wellington 10.98 6.93 4.00
Auckland 9.27 9.02 0.20
Counties Manukau 1.52 4.36 -2.80
Waikato 0.84 5.25 -4.40
Tasman -0.03 -6.29 6.30
Taranaki -1.08 3.92 -5.00
Bay of Plenty -3.10 -1.96 -1.10
Hawke’s Bay -4.36 -6.72 2.40
Otago -5.53 -4.44 -1.10
North Harbour -7.65 -7.43 -0.20
Northland -8.08 -8.26 0.20
Manawatu -9.84 -8.97 -0.90
Southland -10.38 -11.86 1.50


Performance So Far

So far there have been 30 matches played, 24 of which were correctly predicted, a success rate of 80%.

Here are the predictions for last week’s games.

Game Date Score Prediction Correct
1 Auckland vs. Counties Manukau Sep 04 22 – 20 11.00 TRUE
2 Bay of Plenty vs. Canterbury Sep 05 18 – 48 -21.40 TRUE
3 Southland vs. Waikato Sep 06 20 – 16 -8.80 FALSE
4 Tasman vs. Otago Sep 06 49 – 16 5.60 TRUE
5 Taranaki vs. Auckland Sep 07 15 – 51 -0.10 TRUE
6 Hawke’s Bay vs. Counties Manukau Sep 07 24 – 27 -1.10 TRUE
7 Manawatu vs. North Harbour Sep 08 15 – 12 2.20 TRUE
8 Northland vs. Wellington Sep 08 10 – 30 -13.50 TRUE


Predictions for Round 5

Here are the predictions for Round 5. The prediction is my estimated expected points difference with a positive margin being a win to the home team, and a negative margin a win to the away team.

Game Date Winner Prediction
1 Taranaki vs. Hawke’s Bay Sep 11 Taranaki 7.80
2 Wellington vs. Bay of Plenty Sep 12 Wellington 18.60
3 Manawatu vs. Southland Sep 13 Manawatu 5.00
4 North Harbour vs. Tasman Sep 13 Tasman -3.10
5 Waikato vs. Auckland Sep 14 Auckland -3.90
6 Canterbury vs. Otago Sep 14 Canterbury 34.20
7 Counties Manukau vs. Taranaki Sep 15 Counties Manukau 7.10
8 Hawke’s Bay vs. Northland Sep 15 Hawke’s Bay 8.20


Currie Cup Predictions for Round 6

Team Ratings for Round 6

Here are the team ratings prior to Round 6, along with the ratings at the start of the season. I have created a brief description of the method I use for predicting rugby games. Go to my Department home page to see this.

Here are the team ratings prior to this week’s games, along with the ratings at the start of the season.

Current Rating Rating at Season Start Difference
Western Province 3.03 4.47 -1.40
Lions 2.50 -1.22 3.70
Sharks 2.48 3.24 -0.80
Cheetahs -1.71 -2.74 1.00
Blue Bulls -2.75 0.59 -3.30
Griquas -5.70 -6.48 0.80


Performance So Far

So far there have been 15 matches played, 7 of which were correctly predicted, a success rate of 46.7%.

Here are the predictions for last week’s games.

Game Date Score Prediction Correct
1 Griquas vs. Lions Sep 07 32 – 38 0.50 FALSE
2 Blue Bulls vs. Cheetahs Sep 07 26 – 10 4.40 TRUE
3 Western Province vs. Sharks Sep 07 25 – 19 8.50 TRUE


Predictions for Round 6

Here are the predictions for Round 6. The prediction is my estimated expected points difference with a positive margin being a win to the home team, and a negative margin a win to the away team.

Game Date Winner Prediction
1 Cheetahs vs. Lions Sep 13 Cheetahs 3.30
2 Griquas vs. Sharks Sep 14 Sharks -0.70
3 Blue Bulls vs. Western Province Sep 14 Blue Bulls 1.70


NRL Predictions for Finals Week 1

Team Ratings for Finals Week 1

Here are the team ratings prior to this week’s games, along with the ratings at the start of the season. I have created a brief description of the method I use for predicting rugby games. Go to my Department home page to see this.

Current Rating Rating at Season Start Difference
Roosters 11.27 -5.68 17.00
Storm 10.28 9.73 0.60
Sea Eagles 7.75 4.78 3.00
Cowboys 6.88 7.05 -0.20
Rabbitohs 6.08 5.23 0.80
Knights 4.33 0.44 3.90
Bulldogs 4.19 7.33 -3.10
Titans 2.11 -1.85 4.00
Sharks 1.61 -1.78 3.40
Warriors -0.89 -10.01 9.10
Panthers -2.57 -6.58 4.00
Broncos -5.15 -1.55 -3.60
Dragons -8.18 -0.33 -7.90
Raiders -10.23 2.03 -12.30
Wests Tigers -11.37 -3.71 -7.70
Eels -19.87 -8.82 -11.00


Performance So Far

So far there have been 192 matches played, 116 of which were correctly predicted, a success rate of 60.42%.

Here are the predictions for last week’s games.

Game Date Score Prediction Correct
1 Broncos vs. Bulldogs Sep 05 16 – 11 -7.30 FALSE
2 Rabbitohs vs. Roosters Sep 06 12 – 24 2.14 FALSE
3 Dragons vs. Warriors Sep 07 19 – 10 -5.73 FALSE
4 Storm vs. Titans Sep 07 23 – 22 15.58 TRUE
5 Cowboys vs. Wests Tigers Sep 07 50 – 22 21.44 TRUE
6 Sea Eagles vs. Panthers Sep 08 26 – 38 21.52 FALSE
7 Knights vs. Eels Sep 08 54 – 6 23.87 TRUE
8 Raiders vs. Sharks Sep 08 18 – 38 -4.18 TRUE


Predictions for Finals Week 1

Here are the predictions for Finals Week 1. The prediction is my estimated expected points difference with a positive margin being a win to the home team, and a negative margin a win to the away team.

Game Date Winner Prediction
1 Rabbitohs vs. Storm Sep 13 Rabbitohs 0.30
2 Sharks vs. Cowboys Sep 14 Cowboys -0.80
3 Roosters vs. Sea Eagles Sep 14 Roosters 3.50
4 Bulldogs vs. Knights Sep 15 Bulldogs 4.40