What we die of
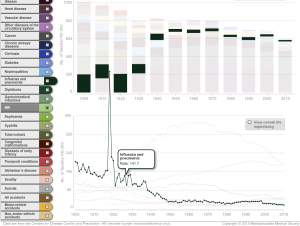
An interesting piece in Slate on longevity (via @juhasaarinen). Unlike the typical story using life expectancy, it’s by someone who seems to understand what it means. There’s also an interactive graph of how causes of death have changed over time, which is notable for having the best use of a creative y-axis scale I’ve seen in a long time.
If you look at ‘influenza and pneumonia’, there is a general decrease with a dramatic spike in 1919. It’s so dramatic that it pops out of the top of the lower panel and spikes into the upper panel. This is the famous Spanish Flu pandemic — the same rate in today’s New Zealand would mean over 25000 deaths. Fortunately the three flu pandemics we’ve had since then have all been much less nasty.
It’s also worth noting that nearly all the decline in infections as a major cause of death happened before antibiotics became widely available in the mid-1940s. That’s the reason I’m not really convinced that antibiotic resistances is going to kill us all, though it’s certainly worth avoiding.
Thomas Lumley (@tslumley) is Professor of Biostatistics at the University of Auckland. His research interests include semiparametric models, survey sampling, statistical computing, foundations of statistics, and whatever methodological problems his medical collaborators come up with. He also blogs at Biased and Inefficient See all posts by Thomas Lumley »

Just curious – how do you make interactive graphics like that? Somehow the graphics have to be turned into a swf file. Can R do that?
Funnily enough the R package R2SWF was removed from CRAN today.
12 years ago
I think more people nowadays use Javascript. You can write SVG from R and then add bits of Javascript, which is how the Royal Society language map was done, or you can use something like the D3 Javascript libraries, which is what the healthvis package does.
Flash doesn’t work on iPads, which is getting to be a serious limitation.
12 years ago
Hi Nick,
R2SWF is alive again, but I agree that SWF may not be a good choice for interactive graphcis. Currently R2SWF does not support interactivity, and to do that you really need some commercial tools.
Maybe you can take a look at Hadley’s ggvis (https://github.com/rstudio/ggvis), which is the next generation of ggplot2.
11 years ago