Posts from July 2013 (70)

July 3, 2013

On sports journalism

I’ve commented on several occasions that it would be great if science journalism was as good as sports journalism.  Here’s a more-detailed quote from Noam Chomsky on the same issue


When I’m driving, I sometimes turn on the radio and I find very often that what I’m listening to is a discussion of sports. These are telephone conversations. People call in and have long and intricate discussions, and it’s plain that quite a high degree of thought and analysis is going into that. People know a tremendous amount. They know all sorts of complicated details and enter into far-reaching discussion about whether the coach made the right decision yesterday and so on. These are ordinary people, not professionals, who are applying their intelligence and analytic skills in these areas and accumulating quite a lot of knowledge and, for all I know, understanding. On the other hand, when I hear people talk about, say, international affairs or domestic problems, it’s at a level of superficiality that’s beyond belief.

(via Chad Orzel, who thinks there’s a snappier version of this out there, but can’t find it)
NRL Predictions, Round 17

Team Ratings for Round 17

Here are the team ratings prior to Round 17, along with the ratings at the start of the season. I have created a brief description of the method I use for predicting rugby games. Go to my Department home page to see this.

Current Rating Rating at Season Start Difference
Rabbitohs 10.67 5.23 5.40
Storm 4.45 9.73 -5.30
Roosters 4.05 -5.68 9.70
Knights 4.01 0.44 3.60
Sea Eagles 3.66 4.78 -1.10
Bulldogs 1.92 7.33 -5.40
Cowboys 0.57 7.05 -6.50
Panthers 0.47 -6.58 7.00
Titans -0.72 -1.85 1.10
Raiders -0.74 2.03 -2.80
Warriors -1.93 -10.01 8.10
Sharks -2.58 -1.78 -0.80
Dragons -3.52 -0.33 -3.20
Broncos -3.59 -1.55 -2.00
Wests Tigers -6.05 -3.71 -2.30
Eels -14.42 -8.82 -5.60


Performance So Far

So far there have been 118 matches played, 72 of which were correctly predicted, a success rate of 61.02%.

Here are the predictions for last week’s games.

Game Date Score Prediction Correct
1 Rabbitohs vs. Raiders Jun 28 32 – 2 12.39 TRUE
2 Wests Tigers vs. Storm Jun 29 22 – 4 -11.99 FALSE
3 Panthers vs. Dragons Jun 29 25 – 10 6.85 TRUE
4 Knights vs. Titans Jun 30 46 – 16 4.04 TRUE
5 Warriors vs. Broncos Jun 30 18 – 16 7.21 TRUE
6 Cowboys vs. Sharks Jun 30 24 – 4 4.56 TRUE
7 Roosters vs. Sea Eagles Jul 01 18 – 12 4.61 TRUE


Predictions for Round 17

Here are the predictions for Round 17. The prediction is my estimated expected points difference with a positive margin being a win to the home team, and a negative margin a win to the away team.

Game Date Winner Prediction
1 Storm vs. Broncos Jul 05 Storm 12.50
2 Sharks vs. Wests Tigers Jul 05 Sharks 8.00
3 Dragons vs. Roosters Jul 06 Roosters -3.10
4 Titans vs. Panthers Jul 06 Titans 3.30
5 Raiders vs. Cowboys Jul 07 Raiders 3.20
6 Bulldogs vs. Knights Jul 07 Bulldogs 2.40
7 Rabbitohs vs. Warriors Jul 07 Rabbitohs 17.10
8 Sea Eagles vs. Eels Jul 08 Sea Eagles 22.60


Super 15 Predictions, Round 19

Team Ratings for Round 19

This year the predictions have been slightly changed with the help of a student, Joshua Dale. The home ground advantage now is different when both teams are from the same country to when the teams are from different countries. The basic method is described on my Department home page.

Here are the team ratings prior to Round 19, along with the ratings at the start of the season.

Current Rating Rating at Season Start Difference
Crusaders 7.56 9.03 -1.50
Bulls 6.64 2.55 4.10
Chiefs 4.90 6.98 -2.10
Brumbies 4.18 -1.06 5.20
Stormers 2.69 3.34 -0.60
Sharks 1.79 4.57 -2.80
Waratahs 1.62 -4.10 5.70
Reds 0.17 0.46 -0.30
Blues -1.15 -3.02 1.90
Hurricanes -1.82 4.40 -6.20
Cheetahs -3.21 -4.16 0.90
Highlanders -6.88 -3.41 -3.50
Rebels -8.64 -10.64 2.00
Force -9.03 -9.73 0.70
Kings -13.62 -10.00 -3.60


Performance So Far

So far there have been 108 matches played, 75 of which were correctly predicted, a success rate of 69.4%.

Here are the predictions for last week’s games.

Game Date Score Prediction Correct
1 Chiefs vs. Hurricanes Jun 28 34 – 22 8.70 TRUE
2 Highlanders vs. Crusaders Jun 29 12 – 40 -8.90 TRUE
3 Sharks vs. Blues Jun 29 22 – 20 7.90 TRUE
4 Bulls vs. Kings Jun 29 48 – 18 21.40 TRUE
5 Stormers vs. Cheetahs Jun 29 28 – 3 5.20 TRUE


Predictions for Round 19

Here are the predictions for Round 19. The prediction is my estimated expected points difference with a positive margin being a win to the home team, and a negative margin a win to the away team.

Game Date Winner Prediction
1 Crusaders vs. Chiefs Jul 05 Crusaders 5.20
2 Hurricanes vs. Highlanders Jul 06 Hurricanes 7.60
3 Cheetahs vs. Blues Jul 06 Cheetahs 1.90
4 Kings vs. Stormers Jul 06 Stormers -13.80
5 Bulls vs. Sharks Jul 06 Bulls 7.40


July 2, 2013

Triggering the Alltrials campaign

The New York Times has a detailed story about one of the triggers for the Alltrials campaign, the missing studies of Tamiflu

He was curious about one of the main studies on which Dr. Jefferson had relied in his previous analysis. Called the Kaiser study, it pooled the results of 10 clinical trials. But Dr. Hayashi noticed that the results of only two of those trials had been fully published in medical journals. Given that details of eight trials were unknown, how could the researchers be certain of their conclusion that Tamiflu reduced risk of complications from flu?

Only about half of all randomized clinical trials are published, despite regulations requiring publication, and the requirements of the Declaration of Helsinki

Authors have a duty to make publicly available the results of their research on human subjects and are accountable for the completeness and accuracy of their reports.

Since the obvious conclusion is that the unpublished studies are less favorable than the published ones, patients and the medical community cannot be sure about the benefits of even the most promising treatments.  The uncertainty always matters at least to a small group of patients, but in the case of Tamiflu it matters to the whole world. The 2009-2010 influenza pandemic was relatively minor, but still killed more than 250000 people worldwide (by most estimates, more than the Iraq war). The 1918 pandemic was at least twenty times worse. Before it happens again, we need to know which treatments work and which do not work.

Ranking America

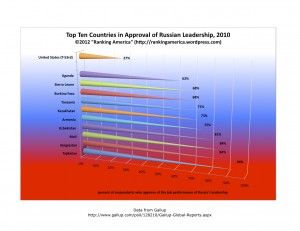
Via BetterPosters, a site devoted to graphics showing the US rank in international comparisons on a range of things.  Some of the graphs are misleading because they look at totals rather than some per-capita quantity and so the US ranks high because it’s a big country.

Others …well, see for yourselves.

preview-of-e2809capproval-of-russian-leadership-xlsxe2809d (1)

July 1, 2013

What’s a Group 1 carcinogen?

Stuff has a (mostly reasonable) story on alcohol and cancer, quoting Prof Doug Sellman

“The ethanol in alcohol is a group one carcinogen, like asbestos,” 

Many of the readers of this story won’t know what a “group one carcinogen” is.  Given the context, a reader might well assume that “group one carcinogens” are those that carry the largest risks of cancer, or cause the most serious cancers. In fact, all it means is that an additional hazard of cancer, whether high or low, has been definitely established, because that’s all the IARC review process tries to do. The Preamble to the IARC Monographs that define these carcinogens says

A cancer ‘hazard’ is an agent that is capable of causing cancer under some circumstances, while a cancer ‘risk’ is an estimate of the carcinogenic effects expected from exposure to a cancer hazard. The Monographs are an exercise in evaluating cancer hazards, despite the historical presence of the word ‘risks’ in the title. The distinction between hazard and risk is important, and the Monographs identify cancer hazards even when risks are very low at current exposure levels, because new uses or unforeseen exposures could engender risks that are significantly higher.

Group 1 carcinogens tend to either be very common exposures or to cause very specific types of cancer, because those are the two scenarios that make it easy to establish definitely that there is a risk.  They include asbestos, arsenic, sunlight, birth control pills, plutonium, diesel exhaust, and wood dust.

Some group 1 carcinogens, such as tobacco and hepatitis B, are responsible for large numbers of cancer deaths worldwide. Others, such as plutonium and diethylstilbestrol, are responsible only for small numbers of deaths. Some group 1 carcinogens cause aggressive, untreatable tumours; for others, such as human papillomavirus, disease is largely preventable by screening; still others, such as sunlight, sometimes cause serious disease but mostly cause relatively minor tumours.

The phrase “group one carcinogen” is only relevant in an argument over whether the risk is zero or non-zero. Its use in other contexts suggests that someone doesn’t know what it means, or perhaps hopes that you don’t.

Stat of the Week Winner: June 22 – 28 2013

Congratulations to Nick Iversen for his nomination of this stat of the week from the NZ Herald:

This story states that “Public opinion has turned …” To justify this they quote statistics from surveys done in 1012 and 2103.

But the surveys are not comparable. They asked different questions.

The 2012 survey questions and results:

I disapprove 40.3%
I approve 19.6%
I conditionally approve 37.7%

The 2013 survey questions and results:

I disapprove 61.5%
I approve 33.8%

When the condition (that the number of pokie machines drops across the city) was removed from the 2013 survey those respondents had to switch to a new answer.

My guess is that most would have switched to “I disapprove” because their approval was conditional and the condition has now been removed. If so then the 2012 survey would have had results:

I disapprove 78.0%
I approve 19.6%

In that case public opinion has moved in the opposite direction to that in the headline.

Even if only half would have switched the figures would have been

I disapprove 59.2%
I approve 38.5%

and it still looks like the opposite to the headline.

The headline is pure fiction. The numbers don’t support it. The two surveys can’t be compared.

For more, see Thomas’ post on this.

Evidence of absence is not absence of evidence

More on the ongoing fluoridation story:

Firstly, there is a very good statement from the PM’s chief science adviser, Peter Gluckman.  As he says, the scientific issues are entirely settled: at the concentrations used in treating water, fluoride reduces tooth decay and does not cause any harm.  At one time there was scientific uncertainty about adverse health effects; this is just not the case any more.  There is still a question of whether you want to treat the whole population in this way.  We add iodine to salt and folate to bread, but these prevent more serious illnesses than fluoridation does, and there are fewer people with an irrational fear of iodine or folate.

Second, the Herald has a Digipoll on fluoridation

The poll showed 48 per cent of New Zealanders supported the addition of fluoride – double the 25 per cent of those who opposed its use. A further 24 per cent believed the issue should be left to local councillors to decide.

Unfortunately, the poll tried to use a single question to address two unrelated issues: do you want fluoride in your water?, and should the decision be made nationally or locally?  As a consequence, it’s hard to interpret the results.  The ratio of for:against is about the same as in the Hamilton referendum that started fluoridation there in 2006, but if you assume all the people who want the issue decided locally  are really against fluoridation, the opinion would be nearly 50:50.  It obviously isn’t reasonable to assume everyone in favour of local decision-making is against fluoridation — I’m on record as a counterexample — but there’s no way to know how these folks would split.

The Herald story goes on to quote an antifluoride lobbyist

Ms Byrne said the group had science to back its claims that fluoride was toxic and harmful when added to water and without applying it directly to teeth offered none of the benefits health authorities claimed.

However, that is hotly disputed within the science community.

It’s not disputed within the scientific community, it’s disputed by the scientific community. The science, as Sir Peter observes, is settled.

Stat of the Week Competition: June 29 – July 5 2013

Each week, we would like to invite readers of Stats Chat to submit nominations for our Stat of the Week competition and be in with the chance to win an iTunes voucher.

Here’s how it works:

  • Anyone may add a comment on this post to nominate their Stat of the Week candidate before midday Friday July 5 2013.
  • Statistics can be bad, exemplary or fascinating.
  • The statistic must be in the NZ media during the period of June 29 – July 5 2013 inclusive.
  • Quote the statistic, when and where it was published and tell us why it should be our Stat of the Week.

Next Monday at midday we’ll announce the winner of this week’s Stat of the Week competition, and start a new one.

(more…)

Stat of the Week Competition Discussion: June 29 – July 5 2013

If you’d like to comment on or debate any of this week’s Stat of the Week nominations, please do so below!