Posts from July 2013 (70)

July 12, 2013

Did he ever return?

Irene Ros has a visualisation of ridership on the Boston subway (famous from the Kingston Trio song back before I was born)

You can see how the rush-hour varies across the subway lines, with the Silver Line (to the airport) having only an evening rush hour, the Green line having a moderate morning peak,  the Red and Orange lines having about the same peak in the morning and evening, and the Blue line having more of a peak in the morning.


Is this a record?

In what may be the least accurate risk estimate ever published in a major newspaper, the Daily Mail said last week

  • Hormone replacement could cause meningioma in menopausal women
  • Those using HRT for a decade have a 70% chance of developing a tumour
  • Most are benign but 15% are malignant and all have damaging side effects

You don’t actually need to look up any statistics to know this is wrong, just ask yourself how many women you know who had brain surgery. Hormone replacement therapy was pretty common (until it was shown not to prevent heart disease), so if 70% of women who used it for a decade ended up with meningioma, you’d know, at a minimum, several women who had brain surgery for cancer.  Do you?

In fact, according to the British NHS, the lifetime risk of meningioma is about 0.07%. Since it’s more common in women, that might be as much as 0.1% lifetime risk for women. The research quoted by the Mail actually found a relative risk of 1.7, so the lifetime risk might be up to 0.17% in women who take a decade of hormone replacement therapy. That is, the story overestimates the risk by 69.8 percentage points, or a factor of more than 400.

While this may be a record so far, there’s still room for improvement, and I certainly wouldn’t bet on the record standing for ever.

(via @hildabast and @BoraZ on Twitter, and Paul Raeburn of the MIT science journalism program)

In real terms

From @LIVENewsDesk on Twitter, and then Stuff, we have record nominal prices for petrol.

Adjusted for inflation, the price is still definitely lower than in mid-2008, when it got to $2.18, which is $2.41 in today’s money, and driving is much cheaper than in was in the mid-1980s.

Also, neither Stuff nor the AA still seem to know about the government’s independent petrol-price monitoring system. Their estimate of the importer margin has been stable since May, but is well above recent historical levels.

July 11, 2013

It’s not as bad as you think

The Royal Statistical Society has just commissioned an opinion poll to look at beliefs about policy-relevant issues and how they relate to reality.  The first few results:

  1. Teenage pregnancy: on average, we think teenage pregnancy is 25 times higher than official estimates: we think that 15% of girls under16 get pregnant each year, when official figures suggest it is around 0.6%.
  2. Crime: 58% do not believe that crime is falling, when the Crime Survey for England and Wales shows that incidents of crime were 19% lower in 2012 than in 2006/07 and 53% lower than in 1995. 51% think violent crime is rising, when it has fallen from almost 2.5 million incidents in 2006/07 to under 2 million in 2012.
  3. Job-seekers allowance: 29% of people think we spend more on JSA than pensions, when in fact we spend 15 times more on pensions (£4.9bn vs £74.2bn).
  4. Benefit fraud: people estimate that 34 times more benefit money is claimed fraudulently than official estimates: the public think that £24 out of every £100 spent on benefits is claimed fraudulently, compared with official estimates of £0.70 per £100.

You might look up what the actual figures are in New Zealand. To get you started, Paula Bennett claimed about $200 million in benefit fraud in 2010/11 (and about 10% of that was prosecuted) from about $9 billion, or about 22c per $100.

July 10, 2013

NRL Predictions, Round 18

Team Ratings for Round 18

Here are the team ratings prior to Round 18, along with the ratings at the start of the season. I have created a brief description of the method I use for predicting rugby games. Go to my Department home page to see this.

Current Rating Rating at Season Start Difference
Rabbitohs 10.66 5.23 5.40
Roosters 7.34 -5.68 13.00
Storm 6.39 9.73 -3.30
Sea Eagles 5.40 4.78 0.60
Knights 4.85 0.44 4.40
Panthers 3.00 -6.58 9.60
Bulldogs 1.08 7.33 -6.20
Cowboys 0.09 7.05 -7.00
Raiders -0.26 2.03 -2.30
Warriors -1.92 -10.01 8.10
Sharks -1.98 -1.78 -0.20
Titans -3.25 -1.85 -1.40
Broncos -5.54 -1.55 -4.00
Wests Tigers -6.65 -3.71 -2.90
Dragons -6.81 -0.33 -6.50
Eels -16.16 -8.82 -7.30


Performance So Far

So far there have been 126 matches played, 78 of which were correctly predicted, a success rate of 61.9%.

Here are the predictions for last week’s games.

Game Date Score Prediction Correct
1 Storm vs. Broncos Jul 05 32 – 0 12.54 TRUE
2 Sharks vs. Wests Tigers Jul 05 36 – 22 7.97 TRUE
3 Dragons vs. Roosters Jul 06 0 – 36 -3.06 TRUE
4 Titans vs. Panthers Jul 06 18 – 40 3.32 FALSE
5 Raiders vs. Cowboys Jul 07 26 – 18 3.19 TRUE
6 Bulldogs vs. Knights Jul 07 12 – 18 2.41 FALSE
7 Rabbitohs vs. Warriors Jul 07 30 – 13 17.10 TRUE
8 Sea Eagles vs. Eels Jul 08 50 – 10 22.57 TRUE


Predictions for Round 18

Here are the predictions for Round 18. The prediction is my estimated expected points difference with a positive margin being a win to the home team, and a negative margin a win to the away team.

Game Date Winner Prediction
1 Broncos vs. Sharks Jul 12 Broncos 0.90
2 Eels vs. Panthers Jul 13 Panthers -14.70
3 Bulldogs vs. Storm Jul 14 Storm -0.80
4 Cowboys vs. Sea Eagles Jul 15 Sea Eagles -0.80


Super 15 Predictions, Round 20

Team Ratings for Round 20

This year the predictions have been slightly changed with the help of a student, Joshua Dale. The home ground advantage now is different when both teams are from the same country to when the teams are from different countries. The basic method is described on my Department home page.

Here are the team ratings prior to Round 20, along with the ratings at the start of the season.

Current Rating Rating at Season Start Difference
Crusaders 9.38 9.03 0.40
Bulls 6.14 2.55 3.60
Brumbies 4.18 -1.06 5.20
Chiefs 3.07 6.98 -3.90
Stormers 2.55 3.34 -0.80
Sharks 2.29 4.57 -2.30
Waratahs 1.62 -4.10 5.70
Reds 0.17 0.46 -0.30
Cheetahs -1.69 -4.16 2.50
Blues -2.68 -3.02 0.30
Hurricanes -2.82 4.40 -7.20
Highlanders -5.87 -3.41 -2.50
Rebels -8.64 -10.64 2.00
Force -9.03 -9.73 0.70
Kings -13.47 -10.00 -3.50


Performance So Far

So far there have been 113 matches played, 79 of which were correctly predicted, a success rate of 69.9%.

Here are the predictions for last week’s games.

Game Date Score Prediction Correct
1 Crusaders vs. Chiefs Jul 05 43 – 15 5.20 TRUE
2 Hurricanes vs. Highlanders Jul 06 44 – 49 7.60 FALSE
3 Cheetahs vs. Blues Jul 06 34 – 13 1.90 TRUE
4 Kings vs. Stormers Jul 06 12 – 24 -13.80 TRUE
5 Bulls vs. Sharks Jul 06 20 – 19 7.40 TRUE


Predictions for Round 20

Here are the predictions for Round 20. The prediction is my estimated expected points difference with a positive margin being a win to the home team, and a negative margin a win to the away team.

Game Date Winner Prediction
1 Crusaders vs. Hurricanes Jul 12 Crusaders 14.70
2 Rebels vs. Highlanders Jul 12 Rebels 1.20
3 Blues vs. Chiefs Jul 13 Chiefs -3.30
4 Waratahs vs. Reds Jul 13 Waratahs 4.00
5 Force vs. Brumbies Jul 13 Brumbies -10.70
6 Sharks vs. Kings Jul 13 Sharks 18.30
7 Stormers vs. Bulls Jul 13 Bulls -1.10


July 9, 2013

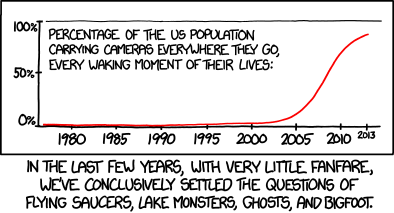
Sometimes absence of evidence is evidence of absence

From XKCD

July 8, 2013

Stat of the Week Winner: June 29 – July 5 2013

Congratulations again to Nick Iverson for his nomination on newspaper headlines about cancer, which is worth a post all by itself. It’s no wonder people are feeling confused about medical advice when most days there’s new headlines with isolated findings:

“Oily fish twice a week is best breast cancer defence.”

Someone should have told Angela Jolie. She thought the best defence was total removal.

Anyway, the Herald previously told us “Biggest breast cancer risks – obesity, alcohol and lack of exercise.”

So make up your mind, Herald, is the biggest risk lack of fish or obesity, alcohol and lack of exercise?

By the way, salted fish is another Group 1 carcinogen. So presumably your oily fish mustn’t be salted. And it must be oily not fatty because “Fatty food linked to breast cancer”.

Other big breast cancer risks: “HRT doubles danger of breast cancer” and your risk is also doubled by NOT having a teen pregnancy.

Also being a professional almost doubles your risk “Professional women more susceptible to breast cancer”, and living in NZ doubles your risk “Breast cancer: Geographic links analysed”.

Not finished yet.

Air fresheners double your risk “Breast cancer link to air fresheners”; being left handed doubles your risk “Left-handed women’s risk of breast cancer higher”.

Taking vitamin pills adds 20% to your risk “Major research finds link between multi-vitamin pills and breast cancer”. Whew! That’s a relief. For a minute there I thought it was going to double my risk.

Lost productivity: pick a number, any number

From Wonkblog at the Washington Post, a look at all the things that allegedly cost the US $BIGNUM in productivity, eg

– The fact that so many employees aren’t engaged with their jobs costs U.S. employers a staggering $550 billion per year.

– Parents stressed out about child care cost $300 billion per year in lost productivity.

– Cigarette smoking takes $92 billion per year out of the workplace.

– Then throw in insomnia, which costs another $63 billion per year.

– Let’s not forget excessive commuting, which costs employers $90 billion per year.

Adding up all of the losses gives $1.8 trillion per year. That’s about 12% of US GDP or about 2/3 of US federal government tax receipts.

Kids today moral panic

Stuff has a story with the headline “More kids committing sexual abuse” and the lead

Easy access to increasingly hardcore pornography and the sexualisation of childhood are being blamed for a rise in the number of children sexually abusing each other.

However, if you actually read the story, the only real information is on number of prosecutions, and

 Police say the jump in prosecutions was due to better knowledge and increased reporting of sexual abuse, rather than a rise in incidents.

No other evidence or expert opinion is given to support the claim of a real increase in abuse, which seems to be entirely made up.

And while on the subject of factchecking, Netsafe chief technology officer Sean Lyons is quoted as saying

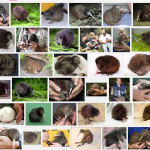
“You type ‘kiwi chicks’ into Google and the images that come back won’t be small feathered birds.”

I tried this. On the first page of results, eight links and the only image displayed were for small feathered birds, one was to a museum project “‘Kiwi Chicks: New Zealand Girl History/Ngā Kōhine Kiwi: He Hitori Taitamāhine o Aotearoa’”, and one was to a page at TheRockFM, which might offend some people but is not anything shocking for kids.

I got basically the same page using lmgtfy.com in a browser not logged into any Google services, so it isn’t just my pure and innocent search history that’s biasing the results.


Update: here’s the first screenfull of results from a Google image search for ‘kiwi chicks’
kiwichicks