Posts from July 2013 (70)

July 23, 2013

Stat of the Week Winner: July 13 – 19 2013

Thank you for the fantastic nominations in last week’s competition.

We’re awarding the prize to Lindsay Mitchell, for her nomination of Stuff’s mixup in the reporting of a statistic:

25 in every 1000 ex-nuptial births occur to women aged between 15 and 19.

Because it is untrue. The claim is a misrepresentation of the following statistic:

25 in 1000 unmarried females aged 15-19 have an ex-nuptial birth (2011)

Sometimes rewording a statistic ends up with a totally different statistic. For example, the proportion of men who are left handed is not the same as the proportion of left handers who are men.

When prediction is useless

We have seen before on StatsChat that, worldwide, there’s no relationship between the position of the moon and the risk of earthquakes.  Suppose, for the sake of argument, that there was some relationship in New Zealand.  Imagine that in Wellington, 100% of big earthquakes happened in the 24-hour period centered on the moon’s closest approach to the earth. The real figure is more like 0%, since Sunday’s earthquake missed the window by a few hours (perigee was 8:28am Monday) and the 1855 Wairarapa quake and the 1848 Marlborough quake missed by days, but we’re running a thought experiment here.  Would this level of prediction be useful?

At one or two big quakes per century, even if they all happened on a predictable day of the lunar month, that’s a risk of between 0.075% and 0.15% per month. At one extreme, you couldn’t evacuate Wellington every month to get around the risk (and even if you did, it would probably cause more injuries each month than happened in Sunday’s quake).  At the other extreme, you could make sure you had a few days supply of water and food, and a plan for communicating with friends and relatives, but that’s a good idea even in the real world where earthquakes are unpredictable.  The only thing I could think of is that you wouldn’t schedule major single-day tourist events (World Cup games, royal visits) or the most delicate pieces of construction work for that day.

[If you want to look up lunar distances, there’s a convenient online calculator. Note that the times are in UTC, so the NZ standard time is 12 hours later than given]
July 22, 2013

CensusAtSchool on Radio New Zealand National this afternoon

A story about one of our Department’s projects, Census at School will air during Afternoons with Jim Mora on Radio New Zealand National (101FM) today, Monday 22 July at 3.30pm, and a slightly longer version again during Our Changing World on Thursday 25 July. Professor Chris Wild and Rachel Cunliffe are among those talked to.

Recycling

The Herald has a story headlined “The high cost of shoplifting in NZ“, which is very similar to the story in Stuff in May that we commented on back then.

We get the figure for total theft from the Retailers Association again, with a similar lack of detail as to what it measures and how, but now without even the estimate of what proportion of it is shoplifting vs theft by staff that was provided in May.  Again there is a set of high-profile or high-value examples given, but now two of the five are from other countries.

The other change is that we now are told that prosecutions for shoplifting have fallen by 20-25% over the past four years, but there is no information on how this relates to the Retailers Association estimate — do they think theft has gone down, and if not, why not?

Stat of the Week Competition: July 20 – 26 2013

Each week, we would like to invite readers of Stats Chat to submit nominations for our Stat of the Week competition and be in with the chance to win an iTunes voucher.

Here’s how it works:

  • Anyone may add a comment on this post to nominate their Stat of the Week candidate before midday Friday July 26 2013.
  • Statistics can be bad, exemplary or fascinating.
  • The statistic must be in the NZ media during the period of July 20 – 26 2013 inclusive.
  • Quote the statistic, when and where it was published and tell us why it should be our Stat of the Week.

Next Monday at midday we’ll announce the winner of this week’s Stat of the Week competition, and start a new one.

(more…)

Stat of the Week Competition Discussion: July 20 – 26 2013

If you’d like to comment on or debate any of this week’s Stat of the Week nominations, please do so below!

July 20, 2013

Briefly

July 18, 2013

Why don’t people know stuff?

There’s been a lot of discussion on the internet and in the UK media about  the Royal Statistical Society’s poll on widespread misbeliefs in the UK, which we covered about a week ago.

One useful response is from Alex Harrowell at The Yorkshire Ranter

The deficit model of ignorance defines ignorance to be a deficiency disease, in which individuals lack facts and are therefore prone to believing nonsense. Ignorant individuals know fewer facts than non-ignorant individuals. This is true as far as it goes. The problem arises when you try to determine causes or prescribe treatment. The deficit model leads to the conclusion that you should, somehow, give them fact pills. Once supplemented with facts, they’ll be OK.

The problem, though, is that this doesn’t actually work, and raises the question as to why they got like that.

July 17, 2013

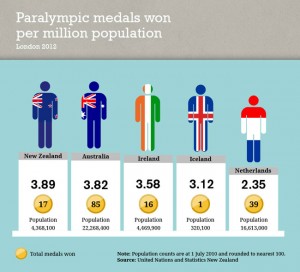
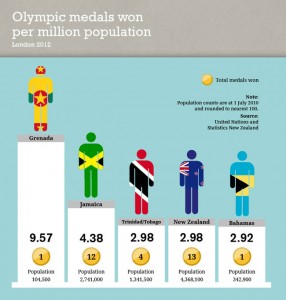
Olympic and Paralympic success (per capita)

From Stats New Zealand

Paralympic medals per capita

yrbk12-paralympic


and (you’ve seen this before) Olympic medals per capita

yrbk12-olympic


Congratulations to the athletes.

This being StatsChat, I will note that it’s not obvious where the bars begin and end in these plots (is the white pedestal included? Is the grey top included? How about the flag-wrapped athlete?), and however I try to do it, the Grenada bar seems to measure less than twice the length of the Jamaica bar, which shouldn’t be the case.


NRL Predictions, Round 19

Team Ratings for Round 19

Here are the team ratings prior to Round 19, along with the ratings at the start of the season. I have created a brief description of the method I use for predicting rugby games. Go to my Department home page to see this.

Current Rating Rating at Season Start Difference
Rabbitohs 10.66 5.23 5.40
Roosters 7.34 -5.68 13.00
Sea Eagles 7.32 4.78 2.50
Bulldogs 5.06 7.33 -2.30
Knights 4.85 0.44 4.40
Storm 2.41 9.73 -7.30
Panthers 2.23 -6.58 8.80
Raiders -0.26 2.03 -2.30
Sharks -1.78 -1.78 0.00
Cowboys -1.83 7.05 -8.90
Warriors -1.92 -10.01 8.10
Titans -3.25 -1.85 -1.40
Broncos -5.73 -1.55 -4.20
Wests Tigers -6.65 -3.71 -2.90
Dragons -6.81 -0.33 -6.50
Eels -15.39 -8.82 -6.60


Performance So Far

So far there have been 130 matches played, 80 of which were correctly predicted, a success rate of 61.54%.

Here are the predictions for last week’s games.

Game Date Score Prediction Correct
1 Broncos vs. Sharks Jul 12 18 – 19 0.94 FALSE
2 Eels vs. Panthers Jul 13 10 – 17 -14.66 TRUE
3 Bulldogs vs. Storm Jul 14 39 – 0 -0.81 FALSE
4 Cowboys vs. Sea Eagles Jul 15 14 – 34 -0.81 TRUE


Predictions for Round 19

Here are the predictions for Round 19. The prediction is my estimated expected points difference with a positive margin being a win to the home team, and a negative margin a win to the away team.

Game Date Winner Prediction
1 Wests Tigers vs. Warriors Jul 19 Warriors -0.20
2 Raiders vs. Eels Jul 20 Raiders 19.60
3 Roosters vs. Sharks Jul 20 Roosters 13.60
4 Panthers vs. Knights Jul 21 Panthers 1.90
5 Sea Eagles vs. Titans Jul 21 Sea Eagles 15.10
6 Rabbitohs vs. Dragons Jul 22 Rabbitohs 22.00