Posts from June 2013 (39)

June 28, 2013

Regions lead post-GFC growth?

From Stuff

Auckland may have the population, but Taranaki, Southland and the West Coast were the fastest-growing regions in the aftermath of the global financial crisis, new figures show.

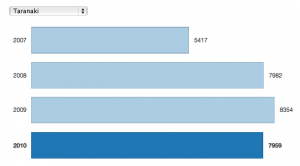
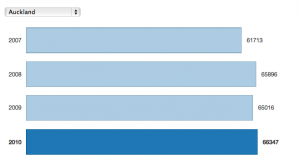
That’s true, but if you look at the pretty interactive graphics, the differences in growth are basically restricted  to growth from 2007 to 2008.  Changes since then have been small in all regions, and if anything, worse in Taranaki. For example

taranaki


auckland


Apples and orangs

In a Stat-of-the-Week nomination, Nick Iversen points out a Herald story about the convention centre deal, under the headline “Support disappears for convention deal

Public opinion has turned against the Government’s SkyCity international convention centre deal just days before it is due to be signed off, allowing for 230 extra poker machines at the downtown Auckland casino.

The latest Herald-DigiPoll survey shows 61.5 per cent of those polled disapprove of the deal while 33.8 per cent approve.

That’s a sharp turnaround from a year ago when a similar poll found 40.3 per cent disapproved and 57.3 supported it.

As Nick and the SkyCity spokesperson point out, the poll last year had a ‘conditionally approve’ option, so they aren’t really comparable. In fact it’s worse than that. the Herald’s headline last year was “Public opposed to SkyCity deal — or want conditions“, so it’s not just a matter of interpreting last year’s data; the story isn’t even consistent with last year’s headline.

Last year, the poll found 40.3% disapproved, 37.7% approved if the total number of gaming machines across Auckland decreased, and 19.6% approved.   This year 61.5% disapprove and 33.8% approve. It’s hard to decide how the 37.7% of conditional approvals should be apportioned, since the number of machines is going down, but it’s going down for reasons basically unrelated to the SkyCity deal.

Some possibilities

  • All the conditional approvals should be treated as approvals. That’s the Herald’s current interpretation and gives 57.3% approval last year, and a roughly 25% decrease in approval
  • All the conditional approvals should be treated as disapprovals. That was the Herald’s interpretation last year, and gives 19.6% approval last year and and a roughly 13% increase in approval
  • The conditional approvals should be ignored, and we should look at the proportion of approval among those approving or disapproving.  That gives 32.7% approval last year, almost identical to this year.

It’s clear that you really can’t say anything very useful about the change using the two different sets of questions.  On the other hand, it’s also clear that the majority in Auckland is currently opposed to the deal, and if public opinion was relevant to the decision-making process, that, rather than the change since last year, would be the important fact.


June 27, 2013

Making sense of uncertainty

Sense about Science (a British charity whose name, unusually, is actually accurate) have just launched a publication “Making Sense of Uncertainty”, following their previous guides for the public and journalists that cover screening, medical tests, chemical stories, statistics, and radiation.

Researchers in climate science, disease modelling, epidemiology, weather forecasting and natural hazard prediction say that we should be relieved when scientists describe the uncertainties in their work. It doesn’t necessarily mean that we cannot make decisions – we might well have ‘operational knowledge’ – but it does mean that there is greater confidence about what is known and unknown.
Launching a guide to Making Sense of Uncertainty at the World Conference of Science Journalists today, researchers working in some of the most significant, cutting edge fields say that if policy makers and the public are discouraged by the existence of uncertainty, we miss out on important discussions about the development of new drugs, taking action to mitigate the impact of natural hazards, how to respond to the changing climate and to pandemic threats.
Interrogated with the question ‘But are you certain?’, they say, they have ended up sounding defensive or as though their results are not meaningful. Instead we need to embrace uncertainty, especially when trying to understand more about complex systems, and ask about operational knowledge: ‘What do we need to know to make a decision? And do we know it?’ 

Guide to reporting clinical trials

From the World Conference of Science Journalists, via @roobina (Ruth Francis), ten tweets on reporting clinical trials

  1. Was this #trial registered before it began? If not then check for rigged design, or hidden negative results on similar trials.
  2. Is primary outcome reported in paper the same as primary outcome spec in protocol? If no report maybe deeply flawed.
  3. Look for other trials by co or group, or on treatment, on registries to see if it represents cherry picked finding
  4. ALWAYS mention who funded the trial. Do any of ethics committee people have some interest with the funding company
  5. Will country where work is done benefit? Will drug be available at lower cost? Is disorder or disease a problem there
  6. How many patients were on the trial, and how many were in each arm?
  7. What was being compared (drug vs placebo? Drug vs standard care? Drug with no control arm?
  8. Be precise about people/patient who benefited – advanced disease, a particular form of a disease?
  9. Report natural frequencies: “13 people per 10000 experienced x”, rather than “1.3% of people experienced x”
  10. NO relative risks. Paint findings clearly: improved survival by 3%: BAD. Ppl lived 2 months longer on average: GOOD

Who says you can’t say anything useful in 140 characters?

How much does NZ pay?

The Herald has a story about NZ average wage figures published by the job-search website Seek.

Seek’s latest salary report, released today, showed the average salary for jobs advertised on their website, grew to $72,731 per annum – a 1.3 per cent increase on wages since January.

The problem is that this is an average for a set of ads. It’s  not an average for NZ workers as a whole, but it’s not even an average for people who apply for Seek jobs, or even people who get Seek jobs.

The Herald sensibly reports the average hourly wage that StatsNZ computes.

Figures from Statistics NZ show as of March this year, the average hourly wage was $27.48 or $57,158.40 per year.  

Another useful figure is the median weekly income from wage or salary for those receiving some wage or salary, allowing for part-time and overtime work, which the NZ Income Survey estimates (for June 2012) as $806, giving a yearly figure of $42000.

Hand-washing study awash in misunderstanding …


The New York Times has reported on a study in which observers sat discreetly in bathrooms and observed whether people “properly” washed their hands (I reckon it would be quite hard to sit discreetly in a bathroom unless you’re in a cubicle). Anyway, the description of the study gave careful attention to the stats: 10.3% of women and over 15 percent of men didn’t wash at all. Of those who did wash, 22.8% did not use soap. And only 5.8% washed for more than 15 seconds.

The lead author said, “Forty-eight million people a year get sick from contaminated food, and the (American) Centre for Communicable Diseases says 50% would not have gotten sick if people had washed their hands properly. Do as your mum said: Wash your hands.”

Surely there’s some basic confusion over percentages here: 50% of those who got sick wouldn’t have if everyone had washed their hands properly, but we have no idea what percentage of those who don’t wash actually get sick.

As a matter of fact, there is no indication that these particular non-handwashers have anything to do at all with the fact that people eat contaminated food. Does it matter what bathroom activity was being carried out? Whether you use toilet paper or your foot to flush? Whether you work in food services? Whether you subsequently wash your hands before eating dinner?

Though mum may have had good advice, this sort of scare-mongering about food-borne illnesses resulting from not washing one’s hands may actually distract us from the real concerns over germs.

  • Read the full analysis by Rebecca Goldin, here. She is Director of Research for STATS, an American non-profit, non-partisan service that  helps journalists think quantitatively through providing education, workshops and direct assistance with data analysis.
June 26, 2013

Super 15 Predictions for this week

The Super 15 Predictions for this week were published earlier because of a reader request: Super 15 Predictions for Round 18

NRL Predictions, Round 16

Team Ratings for Round 16

Here are the team ratings prior to Round 16, along with the ratings at the start of the season. I have created a brief description of the method I use for predicting rugby games. Go to my Department home page to see this.

Current Rating Rating at Season Start Difference
Rabbitohs 8.91 5.23 3.70
Storm 7.44 9.73 -2.30
Roosters 3.91 -5.68 9.60
Sea Eagles 3.80 4.78 -1.00
Bulldogs 1.92 7.33 -5.40
Titans 1.88 -1.85 3.70
Knights 1.42 0.44 1.00
Raiders 1.02 2.03 -1.00
Panthers -0.35 -6.58 6.20
Cowboys -0.97 7.05 -8.00
Sharks -1.04 -1.78 0.70
Warriors -1.41 -10.01 8.60
Dragons -2.70 -0.33 -2.40
Broncos -4.11 -1.55 -2.60
Wests Tigers -9.05 -3.71 -5.30
Eels -14.42 -8.82 -5.60


Performance So Far

So far there have been 111 matches played, 66 of which were correctly predicted, a success rate of 59.46%.

Here are the predictions for last week’s games.

Game Date Score Prediction Correct
1 Bulldogs vs. Roosters Jun 21 18 – 20 3.64 FALSE
2 Wests Tigers vs. Raiders Jun 22 17 – 12 -8.21 FALSE
3 Eels vs. Rabbitohs Jun 23 10 – 30 -18.53 TRUE
4 Titans vs. Storm Jun 24 18 – 12 -2.83 FALSE


Predictions for Round 16

Here are the predictions for Round 16. The prediction is my estimated expected points difference with a positive margin being a win to the home team, and a negative margin a win to the away team.

Game Date Winner Prediction
1 Rabbitohs vs. Raiders Jun 28 Rabbitohs 12.40
2 Wests Tigers vs. Storm Jun 29 Storm -12.00
3 Panthers vs. Dragons Jun 29 Panthers 6.90
4 Knights vs. Titans Jun 30 Knights 4.00
5 Warriors vs. Broncos Jun 30 Warriors 7.20
6 Cowboys vs. Sharks Jun 30 Cowboys 4.60
7 Roosters vs. Sea Eagles Jul 01 Roosters 4.60


Stem cell bait-and-switch

From Stuff

“I’ll never forget the woman whose knee was injected with stem cells to repair it, and came back two months later saying her skin on her face was smoother and more elastic. We hadn’t touched her face,” he says.

What makes the quote interesting is that it’s being advanced as evidence for, not against, the benefits of stem cells.

Injected stem-cells at least have the potential to work, though the story doesn’t mention any actual controlled trials or anything.  What’s less plausible is the idea that rubbing messenger proteins (cytokines) from stem cells on your skin will have any effect. Despite the best efforts of small children, rubbing stuff on your skin doesn’t usually have the same effects as eating it or injecting it. Skin is there for a reason, and it’s quite good at keeping stuff out of your body, especially huge, fragile molecules like cytokines.

If new skin-care technologies really provided a benefit over ordinary moisturisers, it wouldn’t be hard to collect convincing evidence, as has been done for retinoid creams to treat acne, and chemical skin peels for various skin problems. Unfortunately, the new NZ law on unsupported health claims is just for foods and doesn’t apply to things you rub on your skin.

June 25, 2013

Personal data as a motivator

Almost five months ago, I gave birth to my third child. After each birth, I have tracked my weight loss. I have a few self-chosen rules* for this:

  1. I don’t weigh myself at all during pregnancy. I don’t want to become obsessive about weight gain and didn’t gain what I consider to be unhealthy/ridiculous amounts. I did seem to put on a lot more weight with my third pregnancy, right at the end.
  2. I weigh myself first thing each morning, and only record the weight if it’s gone down. It’s more motivating this way for me.
  3. I eat when I’m hungry, and don’t worry too much about how much I eat in the first three months after giving birth. I always try to eat healthily.
  4. I don’t follow a diet. I do watch what I eat in the evenings as I find this is when I’m most tempted to eat unhealthily. Living reasonably far from food shops helps curb the temptation to go grab snacks.

*I’m not in any way a weight loss expert. Disclaimers etc!

While there’s plenty of cool technology and apps to track your own weight and fitness data such as Fitbit (there’s even Wifi scales!), I’ve been using a more humble approach by just manually typing my weight into Excel.

I’ve found this to be such a great motivator for me to see my progress, and to compare it against previous births. There’s something quite nice about manually collecting data and seeing the graph update.

So, I’m going to do a great reveal and show my graphs so far. I don’t lose weight after giving birth incredibly fast, so I hope this is also a nice example for others to see.

For reference, I’m 174cm tall, and normally about 66-68kg. When I was younger, I was about 62kg. I have exclusively breastfed each of my babies.

weight

For each birth, there’s been an initial dramatic weight loss in the couple of weeks after giving birth (water retention, body changes etc), then there’s been a flat period. Note that I didn’t start tracking my weight until a little later with my first child. Then there’s been periods of quick weight loss (often connected to increased breastfeeding!) and periods of much slower weight loss.

In case you’re wondering, I’m currently feeding my baby a lot more as she’s started waking in the night again as she has a bit of a cold and may be teething or just being a baby and waking more!

After the first two births, I went down to my target normal weight and then stopped weighing myself.