Posts from May 2013 (75)

May 15, 2013

NRL Predictions, Round 10

Team Ratings for Round 10

Here are the team ratings prior to Round 10, along with the ratings at the start of the season. I have created a brief description of the method I use for predicting rugby games. Go to my Department home page to see this.

Current Rating Rating at Season Start Difference
Rabbitohs 9.03 5.23 3.80
Roosters 7.07 -5.68 12.80
Storm 6.55 9.73 -3.20
Sea Eagles 5.44 4.78 0.70
Bulldogs 4.07 7.33 -3.30
Cowboys 2.61 7.05 -4.40
Raiders 0.63 2.03 -1.40
Broncos 0.45 -1.55 2.00
Knights 0.01 0.44 -0.40
Sharks -0.44 -1.78 1.30
Dragons -2.51 -0.33 -2.20
Titans -3.42 -1.85 -1.60
Panthers -4.73 -6.58 1.80
Warriors -8.16 -10.01 1.90
Eels -9.94 -8.82 -1.10
Wests Tigers -10.41 -3.71 -6.70


Performance So Far

So far there have been 72 matches played, 45 of which were correctly predicted, a success rate of 62.5%.

Here are the predictions for last week’s games.

Game Date Score Prediction Correct
1 Rabbitohs vs. Cowboys May 10 28 – 10 9.15 TRUE
2 Wests Tigers vs. Sharks May 10 6 – 30 -0.84 TRUE
3 Warriors vs. Bulldogs May 11 16 – 24 -7.65 TRUE
4 Eels vs. Broncos May 11 19 – 18 -7.61 FALSE
5 Raiders vs. Knights May 12 44 – 14 -1.10 FALSE
6 Titans vs. Dragons May 12 15 – 14 4.24 TRUE
7 Panthers vs. Storm May 12 12 – 10 -8.98 FALSE
8 Sea Eagles vs. Roosters May 13 4 – 16 6.58 FALSE


Predictions for Round 10

Here are the predictions for Round 10. The prediction is my estimated expected points difference with a positive margin being a win to the home team, and a negative margin a win to the away team.

Game Date Winner Prediction
1 Broncos vs. Titans May 17 Broncos 8.40
2 Rabbitohs vs. Wests Tigers May 17 Rabbitohs 23.90
3 Dragons vs. Eels May 18 Dragons 11.90
4 Panthers vs. Warriors May 18 Panthers 7.90
5 Cowboys vs. Roosters May 18 Cowboys 0.00
6 Sharks vs. Raiders May 19 Sharks 3.40
7 Knights vs. Bulldogs May 19 Knights 0.40
8 Storm vs. Sea Eagles May 20 Storm 5.60


Super 15 Predictions, Round 14

Team Ratings for Round 14

This year the predictions have been slightly changed with the help of a student, Joshua Dale. The home ground advantage now is different when both teams are from the same country to when the teams are from different countries. The basic method is described on my Department home page.

Here are the team ratings prior to Round 14, along with the ratings at the start of the season.

Current Rating Rating at Season Start Difference
Crusaders 6.67 9.03 -2.40
Bulls 5.83 2.55 3.30
Brumbies 3.64 -1.06 4.70
Chiefs 3.63 6.98 -3.40
Stormers 3.49 3.34 0.20
Sharks 2.01 4.57 -2.60
Blues 1.03 -3.02 4.10
Reds 0.89 0.46 0.40
Waratahs 0.38 -4.10 4.50
Hurricanes -1.56 4.40 -6.00
Cheetahs -1.94 -4.16 2.20
Highlanders -6.46 -3.41 -3.10
Force -7.96 -9.73 1.80
Rebels -9.98 -10.64 0.70
Kings -14.46 -10.00 -4.50


Performance So Far

So far there have been 81 matches played, 54 of which were correctly predicted, a success rate of 66.7%.

Here are the predictions for last week’s games.

Game Date Score Prediction Correct
1 Chiefs vs. Force May 10 22 – 21 18.40 TRUE
2 Reds vs. Sharks May 10 32 – 17 0.60 TRUE
3 Cheetahs vs. Hurricanes May 10 34 – 39 5.30 FALSE
4 Blues vs. Rebels May 11 36 – 32 17.10 TRUE
5 Waratahs vs. Stormers May 11 21 – 15 -0.10 FALSE
6 Kings vs. Highlanders May 11 34 – 27 -6.10 FALSE


Predictions for Round 14

Here are the predictions for Round 14. The prediction is my estimated expected points difference with a positive margin being a win to the home team, and a negative margin a win to the away team.

Game Date Winner Prediction
1 Hurricanes vs. Chiefs May 17 Chiefs -2.70
2 Rebels vs. Stormers May 17 Stormers -9.50
3 Force vs. Sharks May 17 Sharks -6.00
4 Crusaders vs. Blues May 18 Crusaders 8.10
5 Waratahs vs. Brumbies May 18 Brumbies -0.80
6 Bulls vs. Highlanders May 18 Bulls 16.30
7 Cheetahs vs. Reds May 18 Cheetahs 1.20


You can’t trust those folks

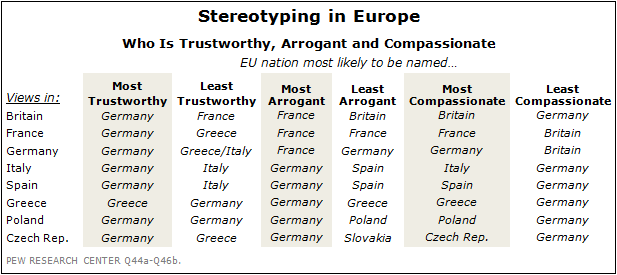
Pew Research have released a report on public opinion in Europe. There’s lots of important stuff in there about austerity, the Euro, unemployment, inequality, and so on.  There’s also this entertaining table:

2013-EU-12


As Robert Burns didn’t quite write: O wad some Pew’R the giftie gie us, To see oursels as ithers see us!

May 14, 2013

Open data: new continents

Two new(ish) Open Data sites are being developed, for Africa and Latin America

These are both in development. The majority of data on the Africa site at the moment is from Kenya; the Latin America site currently has data from Argentina, Chile, Bolivia, and a few others, though nothing from Brazil.

The Latin America site is explicitly focused on the potential for open data to improve government accountability; the Africa site seems to emphasize archiving and access to data. Both are sponsored by the World Bank and have involvement from local journalism.

Dementia: sugar or iPads?

I’ve got no objection to speculative or controversial research being in the media, as long as it’s marked as such, which it often isn’t.

In September, the Herald told us researchers were finding that dementia was due to high blood sugar, essentially a diet and exercise problem.

Today we learn that it’s actually ‘technology’ that causes dementia, in a, like, totally interconnected way

“Considering the changes over the last 30 years – the explosion in electronic devices, rises in background non-ionising radiation – PCs, microwaves, TVs, mobile phones; road and air transport up four-fold increasing background petro-chemical pollution; chemical additives to food, et cetera,” Professor Pritchard said.

“There is no one factor rather the likely interaction between all these environmental triggers, reflecting changes in other conditions.”

What actual research paper found is that the ratio of  diagnoses of neurological diseases  to deaths had risen, across 16 countries, indicating that people live longer after diagnosis.  This could be due to earlier onset, the explanation Prof. Pritchard gives, but they actually don’t do any correction for changes in diagnosis.  Earlier diagnosis could just mean earlier diagnosis, not earlier onset of disease.  Changes in how deaths are classified could also have played a part, although these are less likely to be consistent across countries.

The research paper makes a lot of the fact that dementia in women increased later than in men, attributing this to women entering the workforce and getting exposed to more scary modern stuff (without any actual data on the relative exposure to modern stuff in the workplace and at home).  Surely another possible explanation is that in the modern world, loss of memory and cognitive function is taken seriously in elderly women, but that 30 years ago it just wasn’t regarded as a medical problem.

Survey-manufactured news

A familiar topic on StatsChat is the use of surveys (of widely varying quality) purely to create a press release, in the hope of getting some free product placement from overworked journalists.  The UK blog Ministry of Truth has a detailed look at a company that seems to specialise in this form of marketing

If you didn’t see it on the BBC, then you may well have caught up with the story via the Daily Mail, the Daily Mirror or the Yorkshire Evening Post. In a sense, it doesn’t really matter where you saw the story because they were all churned from the same press release, which had been put out by a  Gloucester-based PR agency called 10 Yetis, and they all, to varying degrees of cut and paste, uncritially reported at least some of the contents of the press release.

It is also, as you may also have already guessed, a complete and utter load of bullshit from start to finish, and that’s really what this particular article is all about.


May 13, 2013

Your guess is as good as ours

There’s currently discussion in NZ about whether to change the 5-yearly census.  North America is providing some examples of what not to do.

Canada decided a while back that they were going to chop most of the questions off the census and put them in a new survey.  The new survey is still sent to everyone, but is voluntary — the worst of both worlds, since a much smaller survey would allow for more effort per respondent in follow-up. Frances Woolley compares the race/ethnicity data from the 2006 Census and the new survey: the survey is dramatically overcounting minorities.

In the USA, a Republican congressman has proposed a bill that would stop the Department of Commerce and the Census Bureau from collecting basically anything other than the census.  That would wipe out the American Community Survey, the detailed 1%/year sample that provides a wide range of regional data. It would also wipe out the Current Population Survey, used to estimate the unemployment rate.  Fortunately for the US economy, there’s no chance of this bill becoming law: the business community hates it, and Senate will never pass it.  It’s still worrying that there’s a public-opinion advantage in pretending you want to abolish the government’s economic data collection.

Stat of the Week Competition: May 11 – 17 2013

Each week, we would like to invite readers of Stats Chat to submit nominations for our Stat of the Week competition and be in with the chance to win an iTunes voucher.

Here’s how it works:

  • Anyone may add a comment on this post to nominate their Stat of the Week candidate before midday Friday May 17 2013.
  • Statistics can be bad, exemplary or fascinating.
  • The statistic must be in the NZ media during the period of May 11 – 17 2013 inclusive.
  • Quote the statistic, when and where it was published and tell us why it should be our Stat of the Week.

Next Monday at midday we’ll announce the winner of this week’s Stat of the Week competition, and start a new one.

(more…)

Stat of the Week Competition Discussion: May 11 – 17 2013

If you’d like to comment on or debate any of this week’s Stat of the Week nominations, please do so below!

May 12, 2013

Briefly