Posts from April 2013 (67)

April 3, 2013

NRL Predictions, Round 5

Team Ratings for Round 5

Here are the team ratings prior to Round 5, along with the ratings at the start of the season. I have created a brief description of the method I use for predicting rugby games. Go to my Department home page to see this.

Current Rating Rating at Season Start Difference
Storm 11.72 9.73 2.00
Sea Eagles 8.46 4.78 3.70
Rabbitohs 6.91 5.23 1.70
Bulldogs 5.13 7.33 -2.20
Knights 3.77 0.44 3.30
Titans 3.54 -1.85 5.40
Cowboys 1.87 7.05 -5.20
Broncos -0.77 -1.55 0.80
Roosters -1.28 -5.68 4.40
Dragons -1.85 -0.33 -1.50
Sharks -2.29 -1.78 -0.50
Raiders -3.44 2.03 -5.50
Wests Tigers -5.46 -3.71 -1.80
Panthers -6.88 -6.58 -0.30
Eels -11.25 -8.82 -2.40
Warriors -11.91 -10.01 -1.90


Performance So Far

So far there have been 32 matches played, 22 of which were correctly predicted, a success rate of 68.75%.

Here are the predictions for last week’s games.

Game Date Score Prediction Correct
1 Sea Eagles vs. Wests Tigers Mar 28 26 – 0 16.52 TRUE
2 Bulldogs vs. Rabbitohs Mar 29 12 – 17 4.65 FALSE
3 Broncos vs. Storm Mar 29 26 – 32 -8.49 TRUE
4 Sharks vs. Dragons Mar 30 12 – 25 8.33 FALSE
5 Panthers vs. Titans Mar 31 10 – 28 -2.90 TRUE
6 Knights vs. Raiders Mar 31 28 – 12 10.64 TRUE
7 Warriors vs. Cowboys Apr 01 20 – 18 -12.11 FALSE
8 Roosters vs. Eels Apr 01 50 – 0 5.59 TRUE


Predictions for Round 5

Here are the predictions for Round 5. The prediction is my estimated expected points difference with a positive margin being a win to the home team, and a negative margin a win to the away team.

Game Date Winner Prediction
1 Bulldogs vs. Sea Eagles Apr 05 Bulldogs 1.20
2 Titans vs. Broncos Apr 05 Titans 8.80
3 Eels vs. Sharks Apr 06 Sharks -4.50
4 Cowboys vs. Panthers Apr 06 Cowboys 13.30
5 Dragons vs. Knights Apr 07 Knights -1.10
6 Warriors vs. Rabbitohs Apr 07 Rabbitohs -14.30
7 Raiders vs. Roosters Apr 07 Raiders 2.30
8 Storm vs. Wests Tigers Apr 08 Storm 21.70


Super 15 Predictions, Round 8

Team Ratings for Round 8

This year the predictions have been slightly changed with the help of a student, Joshua Dale. The home ground advantage now is different when both teams are from the same country to when the teams are from different countries. The basic method is described on my Department home page.

Here are the team ratings prior to Round 8, along with the ratings at the start of the season.

Current Rating Rating at Season Start Difference
Crusaders 9.26 9.03 0.20
Chiefs 8.18 6.98 1.20
Sharks 5.74 4.57 1.20
Stormers 3.61 3.34 0.30
Brumbies 3.58 -1.06 4.60
Hurricanes 2.19 4.40 -2.20
Bulls 1.90 2.55 -0.60
Blues 0.13 -3.02 3.20
Reds -1.22 0.46 -1.70
Cheetahs -3.22 -4.16 0.90
Highlanders -5.32 -3.41 -1.90
Waratahs -6.21 -4.10 -2.10
Force -9.15 -9.73 0.60
Kings -10.02 -10.00 -0.00
Rebels -14.23 -10.64 -3.60


Performance So Far

So far there have been 42 matches played, 31 of which were correctly predicted, a success rate of 73.8%.

Here are the predictions for last week’s games.

Game Date Score Prediction Correct
1 Highlanders vs. Reds Mar 29 33 – 34 0.10 FALSE
2 Hurricanes vs. Kings Mar 30 46 – 30 16.20 TRUE
3 Chiefs vs. Blues Mar 30 23 – 16 11.20 TRUE
4 Brumbies vs. Bulls Mar 30 23 – 20 6.20 TRUE
5 Cheetahs vs. Rebels Mar 30 34 – 16 14.40 TRUE
6 Stormers vs. Crusaders Mar 30 14 – 19 -1.00 TRUE
7 Waratahs vs. Force Mar 31 23 – 19 5.70 TRUE


Predictions for Round 8

Here are the predictions for Round 8. The prediction is my estimated expected points difference with a positive margin being a win to the home team, and a negative margin a win to the away team.

Game Date Winner Prediction
1 Blues vs. Highlanders Apr 05 Blues 8.00
2 Brumbies vs. Kings Apr 05 Brumbies 17.60
3 Sharks vs. Crusaders Apr 05 Sharks 0.50
4 Hurricanes vs. Waratahs Apr 06 Hurricanes 12.40
5 Force vs. Rebels Apr 06 Force 7.60
6 Cheetahs vs. Stormers Apr 06 Stormers -4.30


Briefly

Crime news vs crime data

If you actually look at the data, neither the Herald nor Stuff comes off well in today’s crime figure reports.  Stuff has the headline “Crime drop due to ‘tag and release'”, and it’s not until the third paragraph that they admit the ‘tag and release’ impact is on court workloads and has nothing to do with  number of crimes reported.  The Herald says

Crime is at its lowest level in 24 years but the percentage of offences that police solve is also dropping – less than half of all cases.

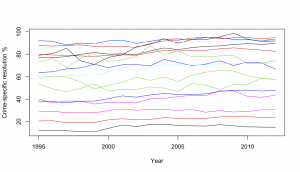
This is at least technically true, but the drop they are talking about is less than one percentage point, when the resolution rate differs between types of crime by about 90 percentage points. Even a small change in the relative numbers of different offenses would make a one percentage difference in overall resolution rate meaningless.  Here, using data from Stats New Zealand are the resolution rates for 16 categories of crime over the past 18 years.

crime-specific

I haven’t tried to label them all, but at the top are homicides, acts intended to cause injury, illegal drug offenses, and offenses against justice procedures and government operations.  The reasons vary:  the resolution rate for violent crimes is high because police put a lot of effort into solving them;  the rate is high for drug offenses because they aren’t usually reported except when the police discover them.  At the low end are burglary and unlawful entry, where the vast majority of cases are never resolved.  If anyone is trying to sell you a policy based on a small change in the average of these, without accounting for variation in proportions, you should keep a firm grip on your wallet.

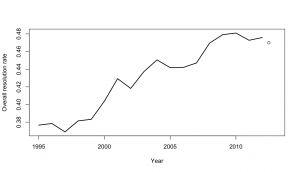
Against that background, what does the trend in resolution rate look like?

overall


The lines show the past 18 fiscal years, the dot shows todays data for the 2012 calendar year.  It’s possible that the resolution rate is flattening out at its peak of 48%, or even decreasing slowly over the past few years, but it’s hardly convincing evidence of a trend.


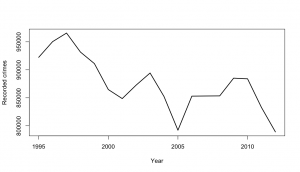
The change in recorded crimes over time is also a fairly noisy trend, but generally downwards even before we account for population growth

recorded


It’s also worth pointing out that preventing crime is important, but catching criminals is beneficial primarily as a means of preventing crime.  A low crime rate with few crimes resolved is far preferable to a high crime rate with most crimes resolved.   The easiest way for the police to increase the resolution rate would be to put more effort into catching drug users, but it would be hard to regard that as the most socially useful way to spend their time and taxpayers money.


April 1, 2013

Briefly

Despite the date, this is not in any way an April Fools post

  • “Data is not killing creativity, it’s just changing how we tell stories”, from Techcrunch
  • Turning free-form text into journalism: Jacob Harris writes about an investigation into food recalls (nested HTML tables are not an open data format either)
  • Green labels look healthier than red labels, from the Washington Post. When I see this sort of research I imagine the marketing experts thinking “how cute, they figured that one out after only four years”
  • Frances Woolley debunks the recent stories about how Facebook likes reveal your sexual orientation (with comments from me).  It’s amazing how little you get from the quoted 88% accuracy, even if you pretend the input data are meaningful.  There are some measures of accuracy that you shouldn’t be allowed to use in press releases.

Stat of the Week Competition: March 30 – April 5 2013

Each week, we would like to invite readers of Stats Chat to submit nominations for our Stat of the Week competition and be in with the chance to win an iTunes voucher.

Here’s how it works:

  • Anyone may add a comment on this post to nominate their Stat of the Week candidate before midday Friday April 5 2013.
  • Statistics can be bad, exemplary or fascinating.
  • The statistic must be in the NZ media during the period of March 30 – April 5 2013 inclusive.
  • Quote the statistic, when and where it was published and tell us why it should be our Stat of the Week.

Next Monday at midday we’ll announce the winner of this week’s Stat of the Week competition, and start a new one.

(more…)

Stat of the Week Competition Discussion: March 30 – April 5 2013

If you’d like to comment on or debate any of this week’s Stat of the Week nominations, please do so below!