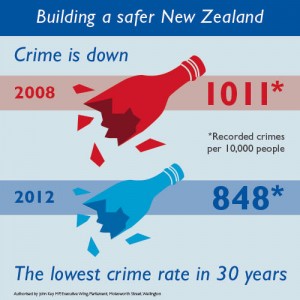
Infographic of the day.
Our only Prime Minister has tweeted an infographic of the new crime figures
In his defense, I will first concede that Mr Key is not regarded as an unbiased source of information, so he doesn’t have the same responsibilities that journalists do.
Still.
One of the basic and classical problems with representing numbers by pictures (apart from the choice of picture) is scaling. The crime rate was 16% lower in 2012 than in 2008. The blue bottle is 16% smaller in every dimension than the red bottle. If you just look at the size of the picture, the area of the blue bottle is nearly 30% smaller than the red bottle. If you take the visual metaphor seriously, these bottles have volume, and the volume of the blue bottle would be 40% smaller.
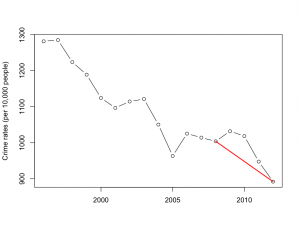
One of the other basic and classical problems discussed in books on misleading statistical graphics is picking two points out of a time series. Using data from Stats New Zealand, we can plot 17 years.
Crime has been decreasing for a long time, at roughly the same rate. Mr Key’s graph corresponds to the red line.
Thomas Lumley (@tslumley) is Professor of Biostatistics at the University of Auckland. His research interests include semiparametric models, survey sampling, statistical computing, foundations of statistics, and whatever methodological problems his medical collaborators come up with. He also blogs at Biased and Inefficient See all posts by Thomas Lumley »


The other thing is that this is recorded crime not actual crime. There used to be a victimisation survey that got at how many people were victimised and if it was reported to police (New Zealand Crime and Safety Survey 2006 and the New Zealand General Social Survey 2008). But if they are still going, nothing is being published.
When recorded crime rates go down then lots of things could be happening:
a) police effort has changed (e.g. due to funding cuts) – you aren’t going to catch underage drinkers if you don’t go where they are drinking or drink drivers if you don’t set up road blocks,
b) demographic change – proportionally fewer young people in the population who are more likely to commit crime (or, at least, non-white collar crime which is what is more likely to be caught) and
c) change in reporting patterns by the population e.g. ethnic changes – where some ethnicities are more suspicious of the police or are shamed within their culture if they are known to have been victimised (e.g. fraud and rape).
Which means the underlying crime rates could be the same as always while recorded crime rates drop.
12 years ago
The only slightly positive thing one can say about the recorded crime rates is that there has not been much change in the relative proportions of the 16 groups that StatsNZ breaks crime down into.
You’d probably expect a big change in proportion of crimes recorded to cause a change in relative proportions, though there’s no logical necessity for that to happen.
12 years ago