Posts from March 2013 (75)

March 5, 2013

Biomarkers and the underpants gnomes

The Gnomes appeared in an episode of South Park. They had a detailed business plan:

  1. Steal underpants
  2. ???
  3. Profit!

I’ve just been pointed to a story `Make your own cancer diagnostic test’, from a newsletter of the Stanford Medical School, about a year ago.  The idea seems to be

  1. Find a biomarker
  2. ???
  3. Diagnostic test!

That is, the story describes how you could use the massive databases of knowledge about gene expression, and the ability to order up inexpensive samples and assays, to find a cancer biomarker, a protein that was present in large quantities in people with a specific type of cancer, but not in healthy people.

There are a few problems before you even get that far, like the fact that most proteins don’t wander around in the blood but stay inside cells or attached to membranes, but those issues could be handled without too much difficulty.  There’s also the possibility that the particular type of cancer you’re looking at doesn’t put large quantities of any unique protein into the blood, but let’s ignore that one.

The real problem is that what you end up with is a strategy for diagnosing cancer in people who already know they have it.  For a diagnostic test to be useful, it has to diagnose cancer accurately, with few false positive, and do it well before you would otherwise know about.  That’s hard.  There are plenty of known protein biomarkers for cancer, but very few of them (some people would say none of them) are currently useful for early detection

To drive this point home: ten years ago, a paper appeared in Proceedings of the National Academy of Sciences, describing a better version of  this proposed search strategy for biomarkers.  It worked, in the sense that they discovered new biomarkers for multiple types of cancer.  With a decade of followup, how many of these have been turned into new diagnostic tests? Not a lot.
NZ language maps

There’s a new information paper from the Royal Society of New Zealand, on languages. We have 160 of them, which is a lot, but the paper says we could do with more coherent policy about them.

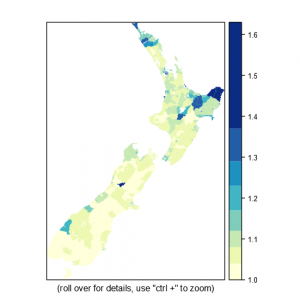
It’s accompanied by some neat interactive maps, produced by Paul Behrens and Jason Gush from the Royal Society and Paul Murrell from our department. The map of average number of languages per person across the country is visually dominated by the largely-rural areas where te reo Maori is widely spoken

Multilingualism1


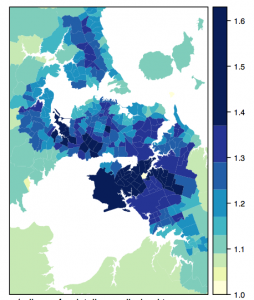
but if you zoom in to Auckland, the detail gets dramatically more complicated.  I speak 0.286 fewer languages than average for my neighbourhood.

aucklang


There are also national maps for  NZ Sign, Samoan, and all other languages combined.


Statistics used for decoration

The story on Stuff starts

Wellingtonians are an inventive bunch, with many in the capital applying to patent ideas they could create income from.

You might expect this would be backed up by data on high or increasing patent submissions from Wellington, but no:

In the year to July 2012, the Intellectual Property Office of New Zealand received 6253 patent applications, compared with 6163 a year earlier.

Last year, 124 were filed from the Wellington region and only 27 were accepted.

That is, the number of patent applications is roughly constant, and Wellington is under-represented in terms of population (and I would have though in terms of number of head offices as well).

The numbers don’t actually add anything to the story, they’re like the little paper umbrellas in a cocktail, intended for decoration rather than consumption.

They think they are representing you

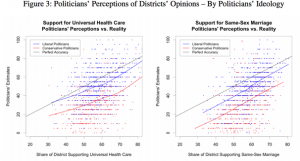
An interesting finding from the US (via):  politicians think their electorates are more conservative than they actually are — slightly more conservative for left-wing politicians, much more conservative for right-wing ones.

broockman_graph


The errors are large: right-wing politicians overestimate the support among their electorate for conservative positions by an average of nearly 20%.  The size of the error, and the big differences by ideology of the politician mean that it can’t just be explained by actual voters being more conservative than the population at large.

March 4, 2013

Briefly

Stat of the Summer Competition Winner!

Thank you for all the fantastic Stat of the Summer nominations.

Congratulations to Jonathan Goodman for winning a copy of Tufte’s book “Beautiful Evidence” whose nomination explained and neatly summarised the NZ Herald article “Women with more sex partners turn to drink and drugs”:

“The title and the first paragraphs make the statements that the more promiscuous you have been in the past, the more likely you are now to be dependent on drugs and alcohol. That being promiscuous causes dependency.

“Women who averaged more than 2.5 sexual partners a year in the years leading up to each interview with the researchers were 10 times as likely as women who had only one or no sexual partners a year to be clinically dependent on alcohol or drugs at age 21. They were seven times as likely by age 26 and 17 times as likely by age 32, even after allowing for all other factors in their lives.”

The increase in likelihood of dependence as the number of years of promiscuity increases is seen as evidence that promiscuity causes alcohol and drug dependence.

However the article then paraphrases the researches by saying “The researchers said the link between the number of partners and later substance dependence might be due to the “shared context” of drinking and meeting people in bars, or to both behaviours being related to underlying risk-taking attitudes.”

While the author of the article claims in the title that researchers have found that promiscuous activities drives people to drink and drugs, all the researchers have found out is that there is a correlation between the two. As we all know Correlation does not imply Causation.”

Thank you to everyone who took part and we are now resuming our weekly competition, so please keep your nominations coming in!

Successful randomized trial of diet

As I have previously observed, there are far too many clever ideas and far too few actual evaluations of effectiveness in diet research, so it’s great to see something that has actually worked.

Researchers in Spain randomized 7500 people at high risk of cardiovascular disease to be told to follow a Mediterranean diet with extra olive oil, a Mediterranean diet with extra nuts, or just to get standard background dietary advice.  The trial was stopped early, after about five years’ followup, because the two Mediterranean diet groups had a substantially lower rate of major cardiovascular events.  The relative risk reduction was about 30%, and the absolute risk reduction about 1 percentage point.

Getting people to adopt a Mediterranean diet may be easier in Spain, so it would be good to have similar results for other recommended diets, eg, based on south-east Asian food.

(via Simply Statistics)

Stat of the Week Competition: March 2 – 8 2013

Each week, we would like to invite readers of Stats Chat to submit nominations for our Stat of the Week competition and be in with the chance to win an iTunes voucher.

Here’s how it works:

  • Anyone may add a comment on this post to nominate their Stat of the Week candidate before midday Friday March 8 2013.
  • Statistics can be bad, exemplary or fascinating.
  • The statistic must be in the NZ media during the period of March 2 – 8 2013 inclusive.
  • Quote the statistic, when and where it was published and tell us why it should be our Stat of the Week.

Next Monday at midday we’ll announce the winner of this week’s Stat of the Week competition, and start a new one.

(more…)

Stat of the Week Competition Discussion: March 2 – 8 2013

If you’d like to comment on or debate any of this week’s Stat of the Week nominations, please do so below!

March 3, 2013

Keep calm and ignore tail risk

Consider a problem in statistical decision theory.

Suppose you can create a t-shirt slogan at zero cost, and submit it for market testing.  If it’s popular, you make money; if it isn’t popular, you pay nothing.  It’s easy to see that you should submit as many t-shirt designs as you can generate: there’s no downside, and the upside might be good.

The problem is that you might create slogans that are sufficiently offensive to get the whole world mad at you.  And if you create more than half a million t-shirt slogans, it’s not all that unlikely that some of them will be really, really, really bad. And it’s not a convincing defense to say that the computer did it, and you didn’t bother checking the results.