Posts from March 2013 (75)

March 14, 2013

Who is buying our real estate?

Interesting data in Stuff today:

The latest BNZ and Real Estate Institute residential market survey found 9 per cent of house sales were to people offshore. 

Of those offshore buyers, 18 per cent were from Britain, 15 per cent from China and 14 per cent from Australia.

and many of the offshore buyers were immigrating, not just investing.  In fact,

just 1.2 per cent of house sales in Auckland were to Chinese buyers not intending to move here.

The only thing the story is missing is some mention of how people got the false impression that high house prices were the fault of Chinese investors.

Could it have been something they read, perhaps?

March 13, 2013

Briefly

“A small, easily checkable fact needs to be checked; a larger but greyer assertion, not so much — unless it is defamatory,” they write. “Thus, verification for a journalist is a rather different animal from verification in scientific method, which would hold every piece of data subject to a consistent standard of observation and replication.”

Is epidemiology 90% wrong?

There’s been a recent recurrence of the factoid that 90% of results in epidemiology are wrong. For example, @StatFact on Twitter posted ‘Empirical evidence is that 80-90% of the claims made by epidemiologists are false.’ with a link to a talk by Stanley Young at the National Institute of Statistical Sciences.  I replied “For suitable values of ‘claim’ and ‘false'”, and if you don’t want to read further, that’s a good summary. (more…)

NRL Predictions, Round 2

Team Ratings for Round 2

Here are the team ratings prior to Round 2, along with the ratings at the start of the season. I have created a brief description of the method I use for predicting rugby games. Go to my Department home page to see this.

Current Rating Rating at Season Start Difference
Storm 10.27 9.73 0.50
Cowboys 8.72 7.05 1.70
Rabbitohs 6.39 5.23 1.20
Bulldogs 5.65 7.33 -1.70
Sea Eagles 5.39 4.78 0.60
Knights 2.77 0.44 2.30
Raiders -0.58 2.03 -2.60
Dragons -0.87 -0.33 -0.50
Titans -1.60 -1.85 0.30
Sharks -2.04 -1.78 -0.30
Broncos -2.17 -1.55 -0.60
Panthers -3.97 -6.58 2.60
Wests Tigers -6.04 -3.71 -2.30
Eels -6.39 -8.82 2.40
Roosters -6.84 -5.68 -1.20
Warriors -12.44 -10.01 -2.40


Performance So Far

So far there have been 8 matches played, 6 of which were correctly predicted, a success rate of 75%.

Here are the predictions for last week’s games.

Game Date Score Prediction Correct
1 Roosters vs. Rabbitohs Mar 07 10 – 28 -6.41 TRUE
2 Broncos vs. Sea Eagles Mar 08 14 – 22 -1.83 TRUE
3 Eels vs. Warriors Mar 09 40 – 10 5.69 TRUE
4 Bulldogs vs. Cowboys Mar 09 12 – 24 4.78 FALSE
5 Panthers vs. Raiders Mar 10 32 – 10 -4.10 FALSE
6 Storm vs. Dragons Mar 10 30 – 10 14.56 TRUE
7 Sharks vs. Titans Mar 10 12 – 10 4.57 TRUE
8 Knights vs. Wests Tigers Mar 11 42 – 10 8.65 TRUE


Predictions for Round 2

Here are the predictions for Round 2. The prediction is my estimated expected points difference with a positive margin being a win to the home team, and a negative margin a win to the away team.

Game Date Winner Prediction
1 Eels vs. Bulldogs Mar 14 Bulldogs -7.50
2 Dragons vs. Broncos Mar 15 Dragons 5.80
3 Cowboys vs. Storm Mar 16 Cowboys 3.00
4 Warriors vs. Roosters Mar 16 Roosters -1.10
5 Titans vs. Raiders Mar 17 Titans 3.50
6 Wests Tigers vs. Panthers Mar 17 Wests Tigers 2.40
7 Sea Eagles vs. Knights Mar 17 Sea Eagles 7.10
8 Rabbitohs vs. Sharks Mar 18 Rabbitohs 12.90


Super 15 Predictions, Round 5

Team Ratings for Round 5

This year the predictions have been slightly changed with the help of a student, Joshua Dale. The home ground advantage now is different when both teams are from the same country to when the teams are from different countries. The basic method is described on my Department home page.

Here are the team ratings prior to Round 5, along with the ratings at the start of the season.

Current Rating Rating at Season Start Difference
Chiefs 9.19 6.98 2.20
Crusaders 6.63 9.03 -2.40
Sharks 4.55 4.57 -0.00
Bulls 3.19 2.55 0.60
Stormers 3.09 3.34 -0.20
Brumbies 2.69 -1.06 3.70
Hurricanes 2.34 4.40 -2.10
Blues 0.26 -3.02 3.30
Reds -0.12 0.46 -0.60
Cheetahs -4.45 -4.16 -0.30
Highlanders -5.77 -3.41 -2.40
Waratahs -6.29 -4.10 -2.20
Kings -9.16 -10.00 0.80
Force -10.16 -9.73 -0.40
Rebels -10.77 -10.64 -0.10


Performance So Far

So far there have been 22 matches played, 16 of which were correctly predicted, a success rate of 72.7%.

Here are the predictions for last week’s games.

Game Date Score Prediction Correct
1 Hurricanes vs. Crusaders Mar 08 29 – 28 -2.30 FALSE
2 Rebels vs. Reds Mar 08 13 – 23 -7.80 TRUE
3 Highlanders vs. Cheetahs Mar 09 19 – 36 6.40 FALSE
4 Brumbies vs. Waratahs Mar 09 35 – 6 8.10 TRUE
5 Stormers vs. Chiefs Mar 09 36 – 34 -2.90 FALSE
6 Kings vs. Sharks Mar 09 12 – 21 -11.60 TRUE
7 Blues vs. Bulls Mar 10 21 – 28 2.60 FALSE


Predictions for Round 5

Here are the predictions for Round 5. The prediction is my estimated expected points difference with a positive margin being a win to the home team, and a negative margin a win to the away team.

Game Date Winner Prediction
1 Highlanders vs. Hurricanes Mar 15 Hurricanes -5.60
2 Waratahs vs. Cheetahs Mar 15 Waratahs 2.20
3 Kings vs. Chiefs Mar 15 Chiefs -14.30
4 Crusaders vs. Bulls Mar 16 Crusaders 7.40
5 Reds vs. Force Mar 16 Reds 12.50
6 Sharks vs. Brumbies Mar 16 Sharks 5.90


March 12, 2013

It’s dry

Interesting new interactive drought map from Stuff.

I’m not 100% convinced it’s better than a couple of contour maps, but it’s probably the best interactive graph I’ve seen in the NZ mainstream media. (via Mike “@adzebill” Dickison on Twitter)

Non-sampled poll reporting

As the Novopay debacle continues, Stuff and the Herald are both reporting a survey done of its members by the Post-Primary Teachers Association. At Stuff, the story begins:

Nearly 36 per cent of secondary school staff are not reporting their Novopay glitches, a survey has found, casting doubt on the Government’s claims of an improvement in the payroll system.

The Post Primary Teachers’ Association found that 38.2 per cent of staff were underpaid, overpaid or not paid at all during the February 20 pay cycle.

That compares with only 1.9 per cent of staff who logged problems with the system, as reported by Novopay Minister Steven Joyce using PricewaterhouseCoopers figures.

In the Herald:

Up to 1600 teachers did not report complaints through official channels over mistakes with their pay administered through the Novopay pay roll system, according to a union survey.

The Post Primary Teachers Association surveyed 4500 teachers for the pay period ending February 20 and found 36 per cent had not formally reported errors with their pay because they were either “too embarrassed” or feared putting school administrators under more pressure.

In this case the PPTA report is easily available (59 page PDF), so we can find out what was actually done.  The union surveyed all its (roughly 18000) members, using an online poll. They received 4659 responses from members, of whom 1712 were affected.

Obviously, teachers who had experienced problems would be more likely to respond, especially if the reason they hadn’t complained to the local administrators was because they didn’t want to put them under more pressure. The PPTA report handles this issue very well. On page 13 they give calculated Novopay error rates under the assumption that 100% of those with problems responded, and under the assumption that the responses are representative. This gives upper and lower bounds, and the lower bound is substantially higher than Novopay is claiming.

In the media stories, things are a bit confused.  The 36% or 38% are proportions assuming the responses were representative. The numbers in the vicinity of 1600 look like the number assuming that everyone adversely affected responds, perhaps minus an estimate of how many of them Novopay reported. I haven’t been able to reconcile them with the PPTA report.  In any case, neither paper accurately described how the data were collected, even though this was made clear by the PPTA.


March 11, 2013

Suppressio variation, suggestio falsi

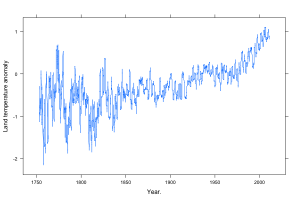
The global mean land-surface temperature reconstruction from the Berkeley Earth Surface Temperature project (other reconstructions are very similar), looks like this:

Rplot001

I’ve scaled the axes using Bill Cleveland’s method of “banking to 45 degrees“, that is, so the median of the slope is 45 degrees.  Based on his research, this seems to give close to optimal perception of patterns. (more…)

How could we test this?

As you will have heard, there is reasonable evidence that an infant has been cured of HIV infection, by giving fairly high doses of antiretroviral drugs immediately after birth.  If this case continues to hold up to investigation, what next?

You would normally want to do a randomized trial, to get evidence that this wasn’t just a one-off fluke, but that’s going to be hard.  Obviously, parents would be very reluctant to have their children randomized. To make matters worse, since the usual antiretroviral treatments are almost completely effective in preventing mother:child transmission, anymost infected infants in Western countries will have been born to mothers who either didn’t know they were infected or knew and were unable to get normal medical care.  This is not a group you want to target for research, for both practical and ethical reasons.   The same issue arises in countries where mother:child transmission is more common. Antiretroviral treatment to prevent transmission is simpler and less expensive than the potentially-curative treatment treatment for the infant, so any system that is able to deliver the cure reliably would rarely need to.

On the other hand, if this (relatively drastic) treatment really does work, not having a randomised trial is likely to slow its acceptance.  Back in the late 1980s, a new lung-bypass technique for premature infants was invented.  This technique, ECMO, appeared to dramatically improve survival, but it required major surgery.  Researchers at the University of Michigan tried a novel ‘play the winner’ trial design that was intended to reduce the number of infants randomized to an ineffective treatment. In a sense, this worked.  The trial ended up randomising 11 infants to ECMO, all of whom survived, and one to standard treatment, who died.  Unfortunately, the trial design was sufficiently unusual and unfamiliar that people didn’t seem to be able to interpret the results (it’s been the subject of multiple statistics papers). A similar design was used in a follow-up trial at Harvard, ending up with 28 infants given  ECMO (with one death) and 10 given standard treatment (with four deaths). Again, there wasn’t consensus on what the result meant, and it wasn’t until after a third, standard randomised trial was done that the treatment was widely used — and if the standard trial had been done first, fewer infants would have been randomised to standard care, and infants outside the trial would have gotten the treatment earlier.

Individual-level randomisation may well not be possible to do efficiently and ethically.  Another approach, in some country that is making efforts to provide prophylaxis against mother:child transmission and that believes treating infected infants is feasible, would be a stepped-wedge design.  This design takes advantage of the fact that we can’t do everything at once.  If treatment is being rolled out across a developing country, some areas will get it first and some will get it later.  Rather than a haphazard allocation (or one based on where the health ministry officials have relatives, or where the international TV representatives want to film) using a truly random order allows evaluation of the effectiveness of treatment policy while still delivering treatment to as many people as possible, as fast as possible.   This design also has the advantage of testing a real public-health question: does a policy of treating infected infants result in fewer infected children?  It’s conceivable, especially in a country where health care is expensive and there’s a lot of prejudice against HIV-positive people, that having treatment available for infected infants could reduce the use of HIV testing and prophylaxis by pregnant women, and the net effect could be negative.
Stat of the Week Competition: March 9 – 15 2013

Each week, we would like to invite readers of Stats Chat to submit nominations for our Stat of the Week competition and be in with the chance to win an iTunes voucher.

Here’s how it works:

  • Anyone may add a comment on this post to nominate their Stat of the Week candidate before midday Friday March 15 2013.
  • Statistics can be bad, exemplary or fascinating.
  • The statistic must be in the NZ media during the period of March 9 – 15 2013 inclusive.
  • Quote the statistic, when and where it was published and tell us why it should be our Stat of the Week.

Next Monday at midday we’ll announce the winner of this week’s Stat of the Week competition, and start a new one.

(more…)