Posts from December 2012 (46)

December 16, 2012

Meet Daisy Shepherd – Statistics Summer Scholarship recipient

This summer, we have a number of fantastic students who received a Department of Statistics scholarship to work on fascinating projects with our staff members. We’ll be profiling them here on Stats Chat and we’d love to hear your feedback on their projects!

Daisy is working with Steffen Klaere on a research project entitled ‘What drives a phylogenetic inference?’

Daisy explains:   

Daisy Shepherd Statistics Scholarship 2012-2013“Phylogenetic inference aims at deriving the most likely ancestry of a set of species, as well as information relating to evolutionary speed and potential related events. It is an important process in which we wish to classify the history of an organism, but we don’t know that history. Thus, we must infer the evolutionary transformations that have taken place, to provide the best estimate of the true phylogeny.

“However, there is one unresolved question in this field – how do we measure the goodness of fit between an inferred model and the actual data we have been provided with? This question remains as a significant area of uncertainty within the major world of phylogenetic inference.

“Thus, the project aims at developing methods that identify data points as outliers. This will allow us to further develop our understanding of whether a suggested ancestry is actually an ideal candidate for a specific organism’s genetic data.”

More about Daisy:

“I am very grateful to have been given this project over summer, and am extremely excited to enter into a different learning environment other than undergraduate study.  Having completed my Bachelor of Science majoring in Mathematics and Statistics, I am returning in 2013 for an Honours programme.  Ever since high school, I have always been fascinated by the logic and nature of these subjects, which naturally led me to studying them at university.  As I ventured through my degree, I further developed my enthusiasm for statistics and increased my awareness of its significance not only within practical situations, but also within everyday real-life situations.

“Outside of my project, I am excited to be reunited with my brother visiting from England, who I have not seen for almost four years!  Hopefully I will be exploring more of New Zealand’s beautiful scenery, and shall be attempting to tan my consistently stubborn, pale English skin.”

December 15, 2012

Meet Nur Azizah Komara Rifai – Statistics Summer Scholarship recipient

This summer, we have a number of fantastic students who received a Department of Statistics scholarship to work on fascinating projects with our staff members. We’ll be profiling them here on Stats Chat and we’d love to hear your feedback on their projects!

Nur Azizah Komara Rifai is working with Yannan Jiang on a research project entitled ‘Trends in typical food portion sizes consumed by New Zealand adults.’

Azizah explains:   

Nur Azizah Komara Rifai Statistics Scholarship 2012-2013 “There is an urgent public health need to reduce obesity. Research from other countries indicates food portion sizes have been increasing parallel with rates of obesity, and are an important contributory factor. But no information currently exists on how New Zealand adults’ food portion sizes are changing over time.
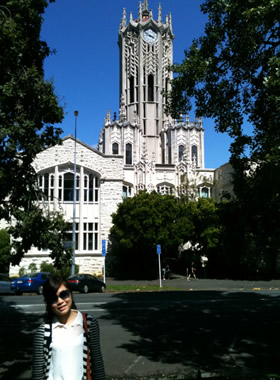
“Data from the National Nutrition Survey in 1997 and 2008/09 will be cleaned, categorised and then analysed using R. I’m interested in using statistics to determine trends in food portion sizes over time and then disseminating those findings to the public.”

More about Azizah:

“I’m from Indonesia. I am studying statistics at Padjadjaran University in Bandung,  the capital of West Java province in Indonesia, and will be travelling to New Zealand to take up the scholarship.

“I experienced a critical period in my life when I was accepted into both my dream course in statistics at Padjadjaran University (despite the prohibitive cost) and the  Chemical Analysts Academy in Bogor (at much cheaper cost). I had to choose between the two, but the decision was made much tougher because my family was hit by the financial crisis.

“I did not want to be selfish with my personal desires, but I also did not want to underestimate my future. It was a very difficult struggle to persuade my parents that I should choose statistics and that it had excellent employment prospects. We prayed for a miracle to pay for the course and finally we solved it.  While I’m unable to pay or replace the struggles my parents went through to get me there, I was able to give them the gift of scoring a perfect 4.00 GPA.”

“I like traditional food like lalap and sambal, watching television, playing the keyboard, drawing, hanging out with my friends, sport (futsal, jogging, badminton, swimming, gymnastics), and reading textbooks.”


Experiment with your vegetables

The Herald has a story on anticancer compounds in broccoli that is actually pretty good. Even the headline only says “Broccoli compound can kill cancer”.

Like all early-stage lab research, the findings will almost certainly not lead to improved treatments, and they don’t provide an additional reason to eat broccoli, but the story does describe what the research found.

December 14, 2012

Meet Richard Hopkins – Statistics Summer Scholarship recipient

This summer, we have a number of fantastic students who received a Department of Statistics scholarship to work on fascinating projects with our staff members. We’ll be profiling them here on Stats Chat and we’d love to hear your feedback on their projects.

Richard Hopkins is working with Paul Murrell on a research project entitled ‘Voronoi treemaps in R’.

Richard explains:

Richard Hopkins Statistics Scholarship “A Voronoi treemap is a graphical, non-rectangular representation of hierarchical data. Voronoi Treemaps are often used to represent population data (subdivisions within the Voronoi treemap represent elements of the population and their respective weights). There are currently algorithms in place that allow a user to generate Voronoi treemaps; however, the algorithms are slow and unstable.

“The purpose of my project is to find ways to multi-thread or parallelise the code so that it can run faster. I will attempt to achieve this by doing the following:

  • Cleaning up and packaging the existing source code;
  • Modifying the code to allow for control of different start points for each sub-region;
  • Fine-tuning the NZ price Kaleidoscope example so that it accurately represents data and is aesthetically pleasing;
  • Running the code on high-performance machines to speed things up.

“I will also explore parameters of the algorithm to investigate current stability issues and any others that may arise during the course of the project.”

More about Richard:

“I was born and raised in Auckland. I am of New Zealand and Samoan heritage and I take pride in both sides. Last week, my wife and I celebrated two years of marriage. Although we don’t have children, we have a ton of immediate and extended family members to whom we devote lots of time. We are also heavily involved in our church. I enjoy a wide range of sports, especially basketball, power-lifting and grid iron.

“I recently completed a Bachelor of Science majoring in statistics and computer science. I have also been admitted to the 2013 Honours programme for statistics. I enjoy studying statistics because from a young age I have had an interest in recognising and analysing patterns and trends. I believe that studying statistics will enable me to turn my curiosity about numbers into useful skills, such as forecasting and data mining, that will hopefully benefit individuals, families and communities.”

December 13, 2012

Meet Glenn Thomas – Statistics Summer Scholarship recipient

This summer, we have a number of fantastic students who received a Department of Statistics scholarship to work on fascinating projects with our staff members. We’ll be profiling them here on Stats Chat and we’d love to hear your feedback on their projects!

Glenn Thomas is working with Alan Lee, Ilze Ziedins and Geoff Pritchard on a research project entitled ‘Statistical modelling of telecommunications sector challenges.’

Glenn Thomas Statistics Scholarship Recipient 2012-2013 Glenn explains:

“My project is unique as it is not a traditional project. Instead, I’m doing an internship at Harmonic, a company that provides custom business analytics and software tools to businesses, partnering with various universities including The University of Auckland. Harmonic provides solutions to companies primarily in the telecommunications, energy, and agriculture industries. In particular, I am working on projects in the telecommunications industry and I am also exploring how to deal with big data in R.

“One of the projects I have been working on is an asset life-cycle solution for Telecom New Zealand. The PTSN (Public Switched Telephone Network) is a fundamental asset for Telecom, and Harmonic’s asset-management analytics ensures it runs efficiently by providing monthly information updates to support spares management, failure analysis, disaster recovery and life-cycle planning. My role has been to improve the speed of some of the processes used in the analysis by optimising existing R code and developing custom functions.

“Another project I have been working on in the same industry is SNA (social network analysis), which is the analysis of social networks to deliver customer insight. One of the challenges I am facing is dealing with the large amount of data. Harmonic uses R to deliver statistical solutions, but one of the difficulties in R is working with very large datasets. I’ve been looking into various packages and methods of handling big data in R, and applying it to social network analysis.”

More about Glenn:

“I’ve just completed my third year of a conjoint degree in commerce and science. I know it sounds like an odd combination at first, but I have found the subjects to be quite complementary. My commerce major is finance, and my science majors are statistics and applied mathematics. I chose these subjects initially since I was good at them and enjoyed them at school. But more recently, I have particularly enjoyed the problem-solving side of statistics. That’s what I love about statistics; everything you learn is applicable to solving real-world problems.

“Outside of study, I enjoy getting outdoors and doing some hiking and camping. I recently walked the Hillary Trail, a 70km hike in the WaitakereRanges. I also enjoy water-skiing during the summer. I enjoy investigating the latest technology and, of course, spending time with my family and friends.”

Sure beats paying for your ads

Back in August, we commented on a bogus survey run by a sex toy store, which Stuff thought was news.

Now, three months later, the store has put out another press release(probably NSFW) from the same survey and this time we have two different stories in Stuff and even the Herald thinks it’s news. At least the Otago Daily Times didn’t fall for it.

Again we have figures quoted to a tenth of a percentage point from small subgroups of 1500 respondents (gays, people from Gisborne, 55-59 year olds), which would be meaningless even if this was a real survey.

Sigh.


December 12, 2012

Meet Huan Lin – Statistics Summer Scholarship recipient

This summer, we have a number of fantastic students who received a Department of Statistics scholarship to work on fascinating projects with our staff members. We’ll be profiling them here on Stats Chat and we’d love to hear your feedback on their projects!

Huan Lin is working with Chris Triggs and Pat Riddle (Computer Science) on a research project entitled ‘How many clusters are there, really?’

Huan Lin Statistics Scholarship Recipient 2012-2013 Huan explains:

“Initially, I’m working with two data sets with known properties to compare and contrast distance metrics and clustering algorithms both directly and in presence of noise.

“After this I will work with data sets of mixtures of categorical, binary and continuous variables where there are no predefined clusters. Then, I will investigate clustering algorithms in R and Weka to compare and contrast results. I will be writing R functions to generate datasets with known properties that can be applied to a variety of scenarios.

“At the end of the project, I am expected to become a confident R programmer to write R functions effectively and efficiently.”

More about Huan:

“I am currently in my final year of a BA and BCom conjoint degree, majoring in statistics and accounting. I enjoy learning and exploring statistics because it is a useful tool for us to better understand the world we live in. In addition, statistics provides me with many practical skills that are transferable in a variety of fields, which would be my competitive edge in the workforce.

I also enjoy playful Zumba classes for their music and rhythm. Over the summer, I also plan to study a bit of philosophy and, of course, have some time off to spend with my family and friends.”

December 11, 2012

Meet Kimberley Eccles – Statistics Summer Scholarship recipient

This summer, we have a number of fantastic students who received a Department of Statistics scholarship to work on fascinating projects with our staff members. We’ll be profiling them here on Stats Chat and we’d love to hear your feedback on their projects!

Kimberley Eccles is working with Maxine Pfannkuch and Stephanie Budgett on statistics education research.

Kimberley Eccles - Statistics Scholarship Recipient 2012-2013 Kimberley explains:  

“This summer I am working on a statistics education research project. The researchers wish to introduce some new ideas into the statistics curriculum to aid students’ understanding of some of the big ideas of statistics. Matched pre- and post-tests have been conducted to gauge levels of understanding before and after the concepts are taught.

“Another summer scholarship student and I have been given the task of reading through the test answers to ascertain and report on the level of understanding displayed. We are also identifying and reporting on common misconceptions amongst the students, so that these can be addressed and corrected in future developments of the curriculum.

“We will also be analysing interviews conducted with students using nVivo. These provide a greater ability to investigate the reasoning behind answers that students give to questions, giving a much clearer picture of which ideas are not being properly understood.

“Overall, the project is providing us with an excellent exposure to qualitative data in a way not frequently encountered by students of statistics.”

More about Kimberley:

“I am studying a conjoint degree in law and arts, with a major in statistics. This is usually considered an unusual combination – particularly given that I have no desire to practice law, and intend to teach high-school maths when I graduate.

“I am particularly interested in statistics education because I believe that all too often students are turned off statistics (and math) because of the way that these subjects are taught in school. I see this as quite a tragedy, as the analysis and critical thinking that the subjects ought to teach are extremely important for development and engagement in society.

“More relevantly to my law degree, I have a developing interest in mediation, and alongside my research project I am also training (as a reserve) for an international mediation competition. I hope to combine my interests in education and mediation at some point in the future.”

(Almost) all the world’s powerplants

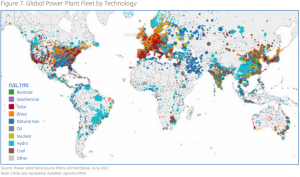
From GE, via Ezra Klein’s blog at the Washington Post, this is supposedly a map of all the powerplants in the world, by size and type.

It looks as though they are missing a few.

NZ data/graphics site

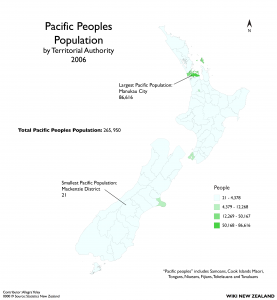
Wiki New Zealand bills itself as “A collaborative website making data about New Zealand accessible for everyone.”

They have lots of graphics of comparative data on New Zealand, with comparisons within the country, over time, and compared to other countries.

Two quibbles: it would be nice if the data source links gave a bit more information on how to find the data than just, eg, pointing to StatsNZ Infoshare.  Also, the thematic maps are currently all of total population counts, without any denominators.