Posts from December 2012 (46)

December 20, 2012

Meet Savannah Post – Statistics Summer Scholarship recipient

This summer, we have a number of fantastic students who received a Department of Statistics scholarship to work on fascinating projects with our staff members. We’ll be profiling them here on Stats Chat and we’d love to hear your feedback on their projects!

Savannah is working with Maxine Pfannkuch and Stephanie Budgett on a research project entitled ‘Statistics Education Research – the bootstrap method’.

Savannah explains:

Savannah Post Statistics Scholarship“I’m working on a collaborative research project looking at statistics education in New Zealand at the secondary and tertiary level. This summer the research team has been expanded to include two research assistants, myself and Kim Eccles (who is also featured on this website). I’m very grateful for the opportunity to work in such an amazing environment and am looking forward to acquiring new skills in research and data analysis over the summer.

“Overall, the project focuses on exploring the ways in which statistics students respond to the concepts taught. We are especially interested in their understanding of two new computer-intensive methods for learning about statistical inference. Over the summer, we will be analysing data obtained from pre- and post-testing as well as interviews, using the computer software package nVivo. From this, we hope to gain some kind of insight into the statistical understanding students develop as a result of the teaching they receive. In particular, we would like to identify which of the “big ideas” are well understood by students and which common misconceptions exist, so that we can improve teaching for future generations of budding statisticians.”

More about Savannah:

“I was originally interested in this project because of my own background in statistics. At school, I developed an early (misguided!) disgust for statistics and would never have taken the subject any further, had Stage 1 statistics not been a compulsory course for my degree. Having since discovered a completely unexpected passion for the subject, I’m excited to be part of a project which I hope will make statistics more accessible and enjoyable for a much wider range of students.

“I have just completed my second year of a conjoint BSc/LLB degree. Aside from my statistics major, I am also completing a second major in chemistry for the BSc component of my degree. I really enjoy the investigative, problem-solving aspect of science and would like to go on to Honours in statistics after I’ve finished my time as an undergraduate. After that, the way forward is a little less clear, but I’m 100% sure that whichever career I end up in, a background in statistics will help me to make more sense of the world around me.

“Outside university, I especially love to sing and am involved with a number of different choirs. I spend one night a week playing social indoor netball, which is a lot of fun – bouncing balls off the walls and down the court takes some time to get used to but makes the game much more interesting! I’m also a member of the Pupuke Rotaract club, which focuses on community service around Auckland. It’s also a great place to socialise with other like-minded people.

“Over the summer, I’m looking forward to doing lots of relaxing: reading, swimming, watching late-night movies, sleeping in and spending lots of time at the beach with family and friends.”

December 19, 2012

Slightly more dead

The Herald’s story  (via Medical Daily) about a report in the BMJ slightly misses the point. The lead says

A new report, published in the British Medical Journal, claims activities like having a couple of drinks, smoking, eating red meat and sitting in front of the TV can cut at least 30 minutes off a person’s life for every day that do it.

None of this is new. What’s new, and the point of the report, is the idea of quoting all these risks in terms of expected life lost, denominated in ‘microlives‘.   David Spiegelhalter, who is Professor for the Public Understanding of Risk, writes in the report:

We are bombarded by advice about the benefit and harms of our behaviours, but how do we decide what is important? I suggest a simple way of communicating the impact of a lifestyle or environmental risk factor, based on the associated daily pro rata effect on expected length of life. A daily loss or gain of 30 minutes can be termed a microlife, because 1 000 000 half hours (57 years) roughly corresponds to a lifetime of adult exposure. From recent epidemiological studies of long term habits the loss of a microlife can be associated, for example, with smoking two cigarettes, taking two extra alcoholic drinks, eating a portion of red meat, being 5 kg overweight, or watching two hours of television a day. Gains are associated with taking a statin daily (1 microlife), taking just one alcoholic drink a day (1 microlife), 20 minutes of moderate exercise daily (2 microlives), and a diet including fresh fruit and vegetables daily (4 microlives). Demographic associations can also be expressed in these units—for example, being female rather than male (4 microlives a day), being Swedish rather than Russian (21 a day for men) and living in 2010 rather than 1910 (15 a day). This form of communication allows a general, non-academic audience to make rough but fair comparisons between the sizes of chronic risks, and is based on a metaphor of “speed of ageing,” which has been effective in encouraging cessation of smoking.

There was a BBC documentary on this subject back in October (a 5-minute clip is available).

Meet Ryan Feyter – Statistics Summer Scholarship recipient

This summer, we have a number of fantastic students who received a Department of Statistics scholarship to work on fascinating projects with our staff members. We’ll be profiling them here on Stats Chat and we’d love to hear your feedback on their projects!

Ryan is working with Brendon Brewer on a research project entitled ‘Uncertainty in faint astronomical images’.

Ryan explains:

Ryan Feyter Statistics Scholarship 2012-2013“Astronomers often take images of the sky, then look for objects such as stars or galaxies in these images. It is of interest to measure the “flux” or total brightness of the objects, which is then used as input to scientific studies. However, this cannot be done accurately because the images are noisy, especially when they are of very faint distant objects such as the first galaxies in the universe.

“Two approaches for estimating flux are in common use. One is to simply add the image pixel values together and use that to estimate the total flux. A more sophisticated approach is to try to infer the underlying noise-free image of the object (using Bayesian methods), and then to calculate the flux of the noise-free image. This second approach is harder and requires more assumptions, but is likely to be more accurate.

“Our project is using simulations to investigate exactly how much more accurate the sophisticated approach is, and whether this remains true even when incorrect assumptions are used.”

More about Ryan:

“I have just finished a Bachelor of Science degree in Statistics and Maths. Next year I will be starting a Bachelor of Science (Honours) in Statistics. Having done statistics and maths has significantly improved my thinking and problem-solving abilities, which has been useful for projects like the one I’m currently involved in and (hopefully) are very desirable traits to have in the workforce.

“I like stats because it can be useful in almost any industry. Almost anything we do produces some data which will then need to be analysed. I have found stats to be the most enjoyable subject I have studied due to the great lecturers and the material having a lot of relevance to real-life problems.

“In my spare time this summer I’ll be spending some time in Christchurch with the family, seeing friends, probably doing a lot of relaxing and playing computer games!”

December 18, 2012

Meet Shuran Yao – Statistics Summer Scholarship recipient

This summer, we have a number of fantastic students who received a Department of Statistics scholarship to work on fascinating projects with our staff members. We’ll be profiling them here on Stats Chat and we’d love to hear your feedback on their projects!

Shuran is working with Ilze Ziedins, Alan Lee and Geoffrey Pritchard on a research project entitled ‘Statistical assessment of telecommunications network performance metrics.’

Shuran explains:

Shuran Yao Statistics Scholarship 2012-2013“My summer research with Harmonic is more like an internship.

Harmonic provides smart solutions using advanced analytics tool R to energy sectors, telecommunications and also agriculture industries.

One of the projects I am involved in is about analysis of social networks to deliver customer insight. I will also be working on checking as well as editing the R training manual by adding some finance related cases.

More about Shuran:

“My primary major is Quantitative Finance. I’m also doing a second major in Statistics. Statistics is a really useful tool that is widely applied in various industries like actuarial science, finance, and telecommunications. The beauty is that it can explore and extract information from piles of numbers.”

December 17, 2012

Turkey arithmetic

Stuff’s story about the price of Christmas food has the headline “Festive food hits Kiwis’ wallets”, and the even more misleading HTML page title “Christmas Dinner Takes Bigger Dent from Wallets.”  The story says

A traditional Christmas dinner with roast chicken or lamb, seasonal vegetables, nibbles and pavlova will set you back about $67.31, up from $54.60 in 2002.

The problem, as usual with stories comparing past and current prices, is that dollars are smaller than they used to be.  In this case the CPI isn’t really the answer — $54.60 in 2002 money is worth about $70 in today’s money, but that just tells us Christmas dinner has gone up less than the average for the CPI basket of goods.

The dent in wallets really depends on how the price compares to income.  If the price had increased as fast as mean household income it would now be $76.38, if it had increased as fast as median household income it would now be $77.55, and if it had increased as fast as the minimum wage it would be $92.18 (StatsNZ, MoBIE).


Unscientific polls of scientists

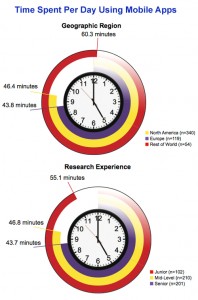
The graph below is an overly-creative variation on barplots, which I think confirms the principle “if you want to write the data values on the graph, it’s probably a bad graph”.

Good thing it wasn't two hours

The data are supposed to be “time per day spent using mobile apps”.  Presumably it’s mean time per day, though I can’t tell whether the mean is restricted to people who spend non-zero time.  The graphs come from a “study” conducted by the “Science Advisory Board®”.  The “Science Advisory Board®” is an online survey panel for market research, where biomedical scientists are the market.  Or as they put it

The Board is an independent, worldwide panel of life science and medical professionals that convenes electronically to voice their opinions on a wide range of topics.

Here “convenes electronically” means “gets sent survey links by email”, and since I’m not a “member”, in my case this means spam about a survey on lab equipment.

The “Science Advisory Board®” homepage includes various things aimed at making their study samples feel like a community. There’s also widget that cycles through their past few days of Twitter feed at a rate of about one every five seconds, and, rather surprisingly for a company that wants to give the impression of solid opinion research, a clicky bogus poll™.

Briefly

  • A zombie story:  Stuff has an opinion piece about chocolate and intelligence, based on the joke article in the New England Journal of Medicine back in October. We covered what was wrong with it then, and showed that you get better correlation with the number of letters in the country’s name than with chocolate consumption.  [Update: the piece is really from an Australian publication, with a light makeover for the Kiwi audience.]
  • A better joke.  An article in the Canadian Medical Association Journal looks at the impact on clinical trials if the world ends on December 21, as the Mayan calendar does not give the slightest suggestion will happen.
  • Language Log examines the inability of journalists around the world to get the basic numbers right in reporting a study on water chlorination and allergies (a story that the NZ media seem to have had the good sense not to pick up).
  • “Good data-driven journalism both publishes as much data as possible, and uses the data to drive conclusions, rather than simply dropping numbers into a foreordained article.”  Felix Salmon, complaining about a New York Times story.
  • The American Statistical Association has a new prize for “Causality in Statistics Education”, aimed at encouraging the teaching of basic causal inference in introductory statistics courses.

Stat of the Summer Competition Discussion: December 15 2012 – March 1 2013

If you’d like to comment on or debate any of the Stat of the Summer nominations, please do so below!

Meet Viet Hoang Quoc – Statistics Summer Scholarship recipient

This summer, we have a number of fantastic students who received a Department of Statistics scholarship to work on fascinating projects with our staff members. We’ll be profiling them here on Stats Chat and we’d love to hear your feedback on their projects!

Viet is working with Thomas Yee on a research project entitled ‘Parameter estimation for selected univariate distributions.’

Viet explains:

Viet Hoang Quoc Statistics Scholarship Recipient 2012-2013“I’m working on various theoretical aspects (investigation of different types of distribution, implementation of new mathematical-based theories) and practical sides (data cleaning, issues in LaTeX and Sweave).
“I am digging into the some distribution theory and related properties (half-normal, truncated geometric, nearest neighbour and so on) in order to expand and diversify our current number of well-known distributions (normal, Poisson) …

“I’m also doing some practical work such as using various approaches to clean large data sets (e.g. removing outliers).

“Checking the functionality of VGLM and VGAM packages is also included in my summer research.”

More about Viet:

“I graduated from the Department of Mathematics majoring in Pure Mathematics along with two minors in Applied Mathematics and Statistics. Statistics has always been a significant interest simply because of its beautiful connection to multiple areas in life such as finance, economics, computer science and many more. Understanding statistics is also very helpful in daily life.

“I’m looking forward to going camping with friends over the Christmas/New Year period.”


Stat of the Summer Competition: December 15 2012 – March 1 2013

This summer, we would like to invite readers of Stats Chat to submit nominations for our Stat of the Summer competition and be in with the chance to win a copy of “Beautiful Evidence” by Edward Tufte:

Here’s how it works:

  • Anyone may add a comment on this post to nominate their Stat of the Summer candidate before midday Friday March 1 2013.
  • Statistics can be bad, exemplary or fascinating.
  • The statistic must be in the NZ media during the period of December 15 2012 – March 1 2013 inclusive.
  • Quote the statistic, when and where it was published and tell us why it should be our Stat of the Summer.

On Monday 4 March 2013 at midday we’ll announce the winner of the Stat of the Summer competition, and restart the weekly competition.

The fine print:

  • Judging will be conducted by the blog moderator in liaison with staff at the Department of Statistics, The University of Auckland.
  • The judges’ decision will be final.
  • The judges can decide not to award a prize if they do not believe a suitable statistic has been posted.
  • Only the first nomination of any individual example of a statistic used in the NZ media will qualify for the competition.
  • Individual posts on Stats Chat are just the opinions of their authors, who can criticise anyone who they feel deserves it, but the Stat of the Week award involves the Department of Statistics more officially. For that reason, we will not award Stat of the Week for a statistic coming from anyone at the University of Auckland outside the Statistics department. You can still nominate and discuss them, but the nomination won’t be eligible for the prize.
  • Employees (other than student employees) of the Statistics department at the University of Auckland are not eligible to win.
  • The person posting the winning entry will receive a copy of “Beautiful Evidence” by Edward Tufte.
  • The blog moderator will contact the winner via their notified email address and request their postal address for the book to be sent to.
  • The competition will commence Saturday 15 December 2012 and continue until midday Friday 1 March 2013.