Posts from November 2012 (71)

November 13, 2012

Overselling medical progress

Overselling the significance of medical research is a familiar problem in the media, with scientists and journalists both being culpable.  There’s a dramatic example going on at the moment, where Pluristem Therapeutics, who made available their in-development treatment on compassionate grounds to three patients, issued press releases with titles such as “Compassionate Use of Pluristem’s PLX Cells Saves the Life of a Child After Bone Marrow Transplantation Failure.” The child died six months later.  One of the other two patients has also died.

Bloomberg News is the main source for this story, and they focused on the impact on share prices and whether the reporting might have violated stock-market regulations, which an expert quoted in the story says is a grey area, and the company denies:

The Haifa, Israel-based company doesn’t follow patients after they are released from the hospital and wasn’t obligated to report the girl’s death, he said.

“What counts legally is whether there is an improvement in the physical condition,” Aberman said in a telephone interview with Bloomberg News. “When we saw significant improvement in the blood count, we declared a successful treatment.”

Even assuming that excitement with the progress of their new treatment was the only factor in the press releases, the whole miracle-cure thing is irresponsible.  Leigh Turner, a bioethicist from Minnesota, (in a blog interview) said it well:

There are some valuable lessons here both for reporters as well as for consumers of news coverage of stem cell research and other areas of science that are routinely overhyped. Whose interests are served when press releases are issued? Is there something significant about timing of press releases? Are independent voices included in news coverage or do all quoted individuals have vested interests in promoting positive account of study results? Why is a press release being issued if results are based upon a single research participant or merely a few research subjects? And finally, what financial interests are swirling beneath the language of “miracles”, “cures”, and “lifesaving” interventions? These are questions reporters should ask and they are also questions those of us who read and otherwise consume the news should consider whenever we are confronted with dramatic claims floated on anecdotes, testimonials, and research “findings” based on meaningless sample sizes.

Pluristem’s work, with placental stem cells, is promising, and they have actual clinical trials starting and planned. That’s how we will be able to tell whether the treatments help patients, and that is what might be worth reporting. (via)
Iris patterns

Nine years ago, the Herald knew that photographs of the iris of the eye were the basis for the most accurate biometric identification technology currently available (except in people with very dark eyes, where it doesn’t work so well). Because the iris is protected by the cornea and doesn’t change over time, it gives much more stable identification than most other biometrics. The main limitation is that people often don’t like putting their eyes close to a camera.

Today, however, the Herald says that iris patterns change rapidly in response to a wide variety of health changes.

Then he looks at the eye where each section of the iris relates to a body part. There may be stress rings, iron, or markings or colours which indicate changes in cholesterol and blood sugar levels, the state of your immune system, memory and circulation issues.

He also looks at the texture of the iris which shows the body’s constitution we are born with. “A strong constitution will look like silk, a weaker constitution will have a rougher texture like hessian.”

At least one of these stories is wrong, and I’m pretty sure I know which one.

November 12, 2012

The rise of the machines

The Herald has an interesting story on the improvements in prediction displayed last week: predicting the US election results , but more importantly, predicting the path of Hurricane Sandy.  They say

In just two weeks, computer models have displayed an impressive prediction prowess.

 The math experts came out on top thanks to better and more accessible data and rapidly increasing computer power.

It’s true that increasing computer power has been important in both these examples, but it’s been important in two quite different ways.  Weather prediction, use the most powerful computers that the metereologists can afford, and they are still nowhere near the point of diminishing returns.  There aren’t many problems like this.

Election forecasting, on the other hand, uses simple models that could even be run on hand calculators, if you were sufficiently obsessive and knowledgeable about computational statistics and numerical approximations.  The importance of increases in computer power is that anyone in the developed world has access to computing resources that make the actual calculations trivial.  Ubiquitous computing, rather than supercomputers, are what has revolutionised statistics.  If you combine the cheapest second-hand computer you can find with free software downloaded from the Internet, you have the sort of modelling resources that the top academic and industry research groups were just starting to get twenty years ago.

Cheap computing means that we can tackle problems that wouldn’t have been worthwhile before.  For example, in a post about the lottery, I wanted to calculate the probability that distributing 104 wins over 12 months would give 15 or more wins in one of the months.  I could probably work this out analytically, at least to a reasonable approximation, but it would be too slow and too boring to do for a blog post.  In less than a minute I could write code to estimate the probabilities by simulation, and run 10,000 samples.  If more accuracy was needed I could easily extend this to millions of samples.  That particular calculation doesn’t really matter to anyone, but the same principles apply to real research problems.

Stat of the Week Competition: November 10 – 16 2012

Each week, we would like to invite readers of Stats Chat to submit nominations for our Stat of the Week competition and be in with the chance to win an iTunes voucher.

Here’s how it works:

  • Anyone may add a comment on this post to nominate their Stat of the Week candidate before midday Friday November 16 2012.
  • Statistics can be bad, exemplary or fascinating.
  • The statistic must be in the NZ media during the period of November 10 – 16 2012 inclusive.
  • Quote the statistic, when and where it was published and tell us why it should be our Stat of the Week.

Next Monday at midday we’ll announce the winner of this week’s Stat of the Week competition, and start a new one.

(more…)

Stat of the Week Competition Discussion: November 10 – 16 2012

If you’d like to comment on or debate any of this week’s Stat of the Week nominations, please do so below!

November 11, 2012

It’s not the sensation, it’s the neuroscience

Philosophers have argued about whether it’s even conceivable to have pain without the physical sensation. According to 3News (and other media outlets worldwide), University of Chicago neuroscientists don’t have a problem with this:

Mathematics can be difficult, and a new study shows even thinking about doing it can physically hurt.

Of course, that’s not quite what the study found (and credit to 3News for linking), though it does seem to be what the researchers said they found. The study was in people with ‘high levels of math anxiety’ and the abstract says

We show that, when anticipating an upcoming math-task, the higher one’s math anxiety, the more one increases activity in regions associated with visceral threat detection, and often the experience of pain itself (bilateral dorso-posterior insula).

That is, some of the parts of the brain that are active during pain or threat were also active when anticipating a maths task, even though there was no actual pain reported.

A simpler explanation might be that if you’re scared of maths, then your brain looks as if you’re scared of something.  Although the researchers don’t believe this, they do actually concede it is an alternative explanation in the discussion section of the paper

the INSp activity we found could be reflective of something else. For example, it has been suggested that INSp activity is not so much reflective of nocioception, but rather reflects detection of events that are salient for (e.g., threatening to) bodily integrity, regardless of the input sensory modality

(via)

Psychic water bills

I’ve just received a water bill which, among other information, estimates my average daily water use for November.  That’s a pretty good trick for something that must have been mailed in the first few days of the month. They mean October, I assume.

Apart from their off-by-one labelling of months, Watercare are interesting because of their ‘estimated’ water usage.  They recently changed to sending monthly bills, but they still only try to read the meter ever second month, and in my case have failed to find it twice.  My first bill on moving in was for three months, and it was relatively high. I fixed the leaky seal in the toilet and expected the bills to go down.  The following month, the meter wasn’t read but my estimated daily water use went up about 7%.  The next month, again there was no meter reading, and the estimated daily use was another 10% higher. The next month the estimated daily use was down about 8%, again with no reading.

I can see why the estimated total usage would fluctuate based on the varying time between estimates, but it’s hard to see what basis Watercare had for estimating I was using more water in September (actually August) than in August (actually July) without any actual data.  I wouldn’t have expected the average Aucklander to use more water in winter, and a research report from Branz confirms my expectation.

This month, now they have found the meter, the estimated use has fallen about 85%, catching up on three months of overbilling.

Point A to Point B

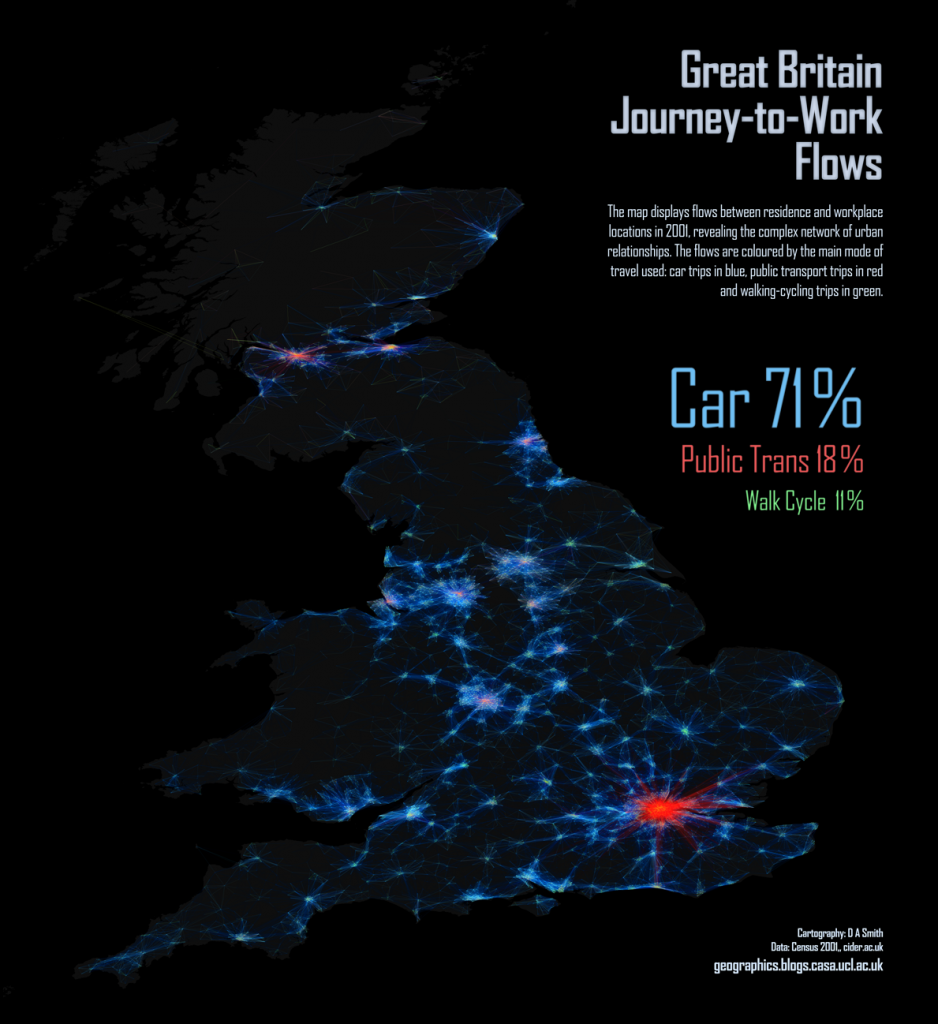
From the Mapping London blog, a picture of commuter flows in Great Britain. The difference in public transport use between London and the other cities is dramatic.  They have lots of other maps, including one of language use in London based on Twitter messages.  That would be interesting to do for NZ cities.

XKCD misfire

The comic XKCD is usually spot-on in statistical commentary, but the most recent attempt doesn’t really work.  There’s a tendency for people who learnt frequentist statistics from bad textbooks and Bayesian statistics from good statisticians to think it’s the philosophy that makes the textbook bad, rather than the textbook that makes the philosophy bad.

I might be considered biased, so I’m outsourcing the details of this complaint to a well-known Bayesian statistician

What do people tweet all day?

We saw the American Time Use Survey earlier this week, but a paper has just been published using a different source of publically-available time use data.

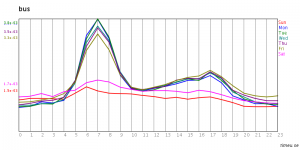
The site timeu.se collects information from Twitter and parses it to extract activities. For example: bus

On weekdays lots of people catch the bus in to work, and then teleport home. Or perhaps commuting home is just less tweet-worthy.

In any case, the data could be useful for picking up strong trends.  The new paper is about migraines, using time-of-day data from the website. The researchers found the expected differences between men and women, and between workdays and weekends/holidays, and the expected early morning peak, suggesting that tweet-mining at least isn’t completely bogus.