Posts from November 2012 (71)

November 29, 2012

You are feeling sleepy

Stuff has a story about an increase in sleeping-pill prescriptions in young people.

The increase in prescriptions is real. What’s more dubious is the explanation that it reflects an increase in sleeping difficulties is being caused by electronic devices, rather than trends in treatment.  It’s not that it’s implausible for gadgets to affect sleep — the mechanisms are fairly clear — it’s more that there isn’t any evidence supplied that sleeping problems are becoming hugely more common.

With the help of the Google and PubMed, I found a few papers looking at time trends in sleep. A recent US paper looked at time-use studies from 1975 to 2006, and found that

Unadjusted percentages of short sleepers ranged from 7.6% in 1975 to 9.3% in 2006.

A Finnish study  found about a 4% decrease in average sleep duration from 1972 to 2005, about half a minute per year.

Other research in both kids and adults seems to agree that sleep duration is decreasing slowly, but not by anything like enough to justify Stuff’s lead:

Your tablet computer, smartphone or other mobile device could be the reason you are not sleeping – and the ubiquitous devices are being cited as a possible cause for a 50 per cent jump in the number of young people scoffing sleeping pills.

It doesn’t make matters better that the “50 per cent jump” is really just for one region in NZ (the Waikato). Or that taking a single 165mg tablet per night is described as “scoffing sleeping pills”.

Congratulations Dr James Russell: 2012 Prime Minister’s MacDiarmid Emerging Scientist Prize

James Russell with Prime Minister John Key

A huge congratulations to our staff member, Dr James Russell who has been awarded the 2012 Prime Minister’s MacDiarmid Emerging Scientist Prize for his internationally-recognised conservation work.

Dr Russell uses an innovative combination of ecology, statistics and genetics to study how rats and other mammalian pests invade predator-free islands and how to prevent this from happening. His work is helping to protect endangered native species and to maintain New Zealand’s reputation as a world leader in island conservation. With more than 80 per cent of the world’s island groups infested with rats, his expertise is also sought internationally to help eradicate and manage pest species.

His doctoral research examined how far rats could travel to predator-free islands and how they spread once they arrive. It led to greater understanding of how pest invasions occur and to new pest management techniques. Dr Russell is now focusing on the interactions between climate change, native and invasive species and ecosystem linkages, to help conserve native species.

He will spend several months in France next year working on conservation projects, and is involved with the Department of Conservation and philanthropist Gareth Morgan on the “Million Dollar Mouse” eradication project on the Antipodes Islands.

Read more about the awards »

Happy little tweeps

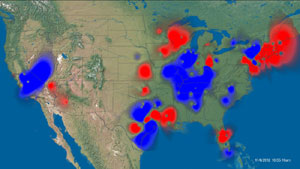
Via Stuff, Twitter heat maps composed by SGI, showing positive and negative sentiment on Twitter on particular topics.

This one is from the US election, and it shows the good and bad aspects of the heatmap.  Since the information is in the colour scale, you don’t have the problem we saw earlier this week


On the other hand, you do have the problem that high population density regions are the ones that show up — giving a perhaps-misleading impression in this image that there was overwhelmingly more positive sentiment than negative about the US election results.

[update: wrong map initially]

November 28, 2012

Hilarious love letter: “statisticians are the new sexy vampires, only even more pasty”

The New Yorker has a hilarious love letter to statistician of the moment, Nate Silver which includes the unforgettable line: “statisticians are the new sexy vampires, only even more pasty”.

It begins:

Dear Nate Silver:
My name is Emma Gertlowitz and I’m eleven years old and for a million years I liked Justin Bieber because he was so cute but now I like you. I watched you on MSNBC and HBO and on “Charlie Rose” and I can’t stop thinking about how you study polls and create probability models and predict elections and how you’re always right, which I think is so unbelievably cute, and I keep imagining you saying to me, “Emma, I think that there’s a 93.7% chance of me falling in love with you.”

Read more…

November 27, 2012

Stats Chat at national journalism teachers’ conference

Polls and surveys making various claims land on journalists’ desks every day – but not all of them are newsworthy (and the bogus, PR-driven ones that make it into print are subsequently shredded in this very forum).

The statschat.org.nz team is always keen to help people understand the difference between a reliable poll and something that should be filed in the bin. So we’re delighted that two members of the statschat.org.nz team, Andrew Balemi, a polls and surveys expert from the Department of Statistics at The University of Auckland, and adviser Julie Middleton have been given an hour at this Wednesday’s Journalists Training Organisation/Journalism Education Association conference to talk about polls and surveys.

They’re not going to each anyone to crunch numbers. What’s far more important is knowing the right questions to ask about a poll or survey to determine whether it should be taken seriously.

This is the hand-out we are providing – we have only an hour, so the list of questions isn’t complete, but it gives you an idea of how we encourage journalists to think.

Questions a reporter should ask of a poll or survey

Why is the poll/survey being done?
What do the pollsters want to find out?

Who is doing the survey?
Who paid for the survey?
Who carried out the work?
Is the person/company that carried out the survey a member of the Market Research Society of New Zealand? (ie, is it subject to a code of ethics?)

What we’re looking for: Evidence of lobbying, misinformation, public-relations or marketing spin … or just a company hoping to get editorial when it should buy an ad.

How representative is the sample?
How were those to be polled/surveyed chosen?
From what area (nation, state, or region) or group (teachers, National voters etc) were these people chosen?
How were the interviews conducted? (Internet survey, face-to-face, by phone)…

What we’re looking for: Evidence that the poll/survey is based on a genuinely representative random sample and has been conducted according to sound statistical principles. Be wary if you can’t get the original research questionnaire, raw data and a full explanation of methods.

If possible, ask about the broader picture
Does this study reflect the findings of other polls/surveys on this topic?

What we’re looking for: Evidence of similar findings elsewhere. 

Is this poll/survey worth reporting?
If you get positive responses to the above, yes. If not, this question becomes a philosophical one: Do you ignore accuracy for a sexy subject? Or run a story based on a bogus survey with a long list of caveats?

Don’t be afraid to ask professional statisticians for advice and help. They will generally be flattered – and pleased that you are taking such care.

Do you feel lucky?

The Herald (as our Stat-of-the-Week nomination points out) is claiming

Manukau is the luckiest Lotto suburb in Auckland, the Herald can reveal.

This looks as if it’s claiming that tickets bought in Manukau have been more likely to win.  If this was true, it would still be useless, because future lotto draws are independent of past ones.

It’s even more useless because there is no denominator: not tickets sold, not people in the suburb, not even number of Lotto outlets in the suburb.

What the statistic, and the accompanying infographic, really identifies is the suburbs that lose the most money on Lotto.  That’s why Manukau and Otara are ‘lucky’ and Mt Eden and Remuera are ‘unlucky’, the sort of willfully perverse misrepresentation of the role of chance that you more usually see in right-wing US outlets.

350 teachers talk statistics

The Auckland Mathematical Association and our Department of Statistics ran a special event at The University of Auckland’s Tamaki campus for 350 Year 13 statistics teachers last Thursday. The workshop introduced teachers to a range of online and interactive tools and resources to support the new statistics curriculum, which starts in the 2013 school year.

The workshop will be repeated in Wellington, Christchurch and Dunedin, with local maths associations running each event. You can find out more about the statistics road tour herephotos and teacher quotes here.

Jason Ellwood of Otumoetai College talks bootstrapping at The University of Auckland Statistics Roadshow, Tamaki campus, Thursday 22 November 2012. Photo: Stephen Barker/Barker Photography, www.barkerphotography.co.nz
©The University of Auckland.

November 26, 2012

Stat of the Week Competition: November 24 – 30 2012

Each week, we would like to invite readers of Stats Chat to submit nominations for our Stat of the Week competition and be in with the chance to win an iTunes voucher.

Here’s how it works:

  • Anyone may add a comment on this post to nominate their Stat of the Week candidate before midday Friday November 30 2012.
  • Statistics can be bad, exemplary or fascinating.
  • The statistic must be in the NZ media during the period of November 24 – 30 2012 inclusive.
  • Quote the statistic, when and where it was published and tell us why it should be our Stat of the Week.

Next Monday at midday we’ll announce the winner of this week’s Stat of the Week competition, and start a new one.

(more…)

Stat of the Week Competition Discussion: November 24 – 30 2012

If you’d like to comment on or debate any of this week’s Stat of the Week nominations, please do so below!

November 25, 2012

XKCD on denominators

XKCD on the data visualisation equivalent of forgetting that Auckland is larger than Wellington

I’m looking at you, Facebook