Posts from September 2012 (71)

September 10, 2012

If you want Australia, you know where to find it.

The new-look Herald has a good survey-based story on where people want to live: they did both in-depth interviews with a moderate number of people, and a reasonably good quantitative survey (online panel-based DigiPoll).

The results say that most people in New Zealand want to live here.  In a sense that’s not surprising — they are living here — and that’s especially true for Australia as an alternative, since it’s not that difficult to move.

A similar US survey a couple of years ago, by the Pew Research Center, didn’t even bother to ask about other countries, just about other places to live in the US.  It’s still a reasonable comparison: different parts of the US are more different than many countries, and some don’t even seem to be in the same universe as each other.  In the Pew survey, nearly half of respondents said they wanted to live in a different kind of community from where they currently live.  Several major cities had nearly 40% approval rating nationwide as somewhere people would like to live: Denver topped the list at 43%, and my previous home in Seattle was at 38%.

So, even accounting for the natural bias towards saying you have chosen the right place to live, Kiwis do seem happy with their home.
Stat of the Week Competition: September 8 – 14 2012

Each week, we would like to invite readers of Stats Chat to submit nominations for our Stat of the Week competition and be in with the chance to win an iTunes voucher.

Here’s how it works:

  • Anyone may add a comment on this post to nominate their Stat of the Week candidate before midday Friday September 14 2012.
  • Statistics can be bad, exemplary or fascinating.
  • The statistic must be in the NZ media during the period of September 8 – 14 2012 inclusive.
  • Quote the statistic, when and where it was published and tell us why it should be our Stat of the Week.

Next Monday at midday we’ll announce the winner of this week’s Stat of the Week competition, and start a new one.

(more…)

Stat of the Week Competition Discussion: September 8 – 14 2012

If you’d like to comment on or debate any of this week’s Stat of the Week nominations, please do so below!

September 9, 2012

Weather forecasting

Nate Silver, baseball statistician and election polling expert, has an article in the New York Times about weather forecasting and how it has improved much more than almost any other area of prediction:

In 1972, the service’s high-temperature forecast missed by an average of six degrees when made three days in advance. Now it’s down to three degrees. More stunning, in 1940, the chance of an American being killed by lightning was about 1 in 400,000. Today it’s 1 in 11 million. This is partly because of changes in living patterns (more of our work is done indoors), but it’s also because better weather forecasts have helped us prepare.

Perhaps the most impressive gains have been in hurricane forecasting. Just 25 years ago, when the National Hurricane Center tried to predict where a hurricane would hit three days in advance of landfall, it missed by an average of 350 miles. … Now the average miss is only about 100 miles.

The reasons are important in the light of today’s Big Data hype: meterologists have benefited from better input data, but more importantly from better models.  Today’s computers can run more accurate approximations to the fluid dynamics equations that really describe the weather. Blind data mining couldn’t have done nearly as well.     (via)

Provenance-free survey data

Stuff reports that 97 per cent of those aged 18-29 are saving for something.  This is attributed to RaboBank

The myth of feckless youth which does not understand the value of money should be laid to rest, new research from online deposit bank RaboDirect suggests.

and you now know everything they’re prepared to admit about how the survey was done.

There isn’t a press release up at RaboBank yet, but the previous press release (from May) is about another survey. It also says nothing about methodology.  There is a link to a PDF, which might have had more details, but it has been taken down.

With more searching I found a RaboBank press release from 2010 that did still have it’s ‘full survey results’ PDF link up — it has lots of colorful bar charts, and while it still doesn’t say anything about how the data were collected, the footnotes to the graphs include sample sizes and a little magenta logo that suggests the data were collected by market research firm TNS and were probably some sort of online panel.  So that Rabobank survey wasn’t totally bogus — there’s disagreement about the accuracy of this approach, but at least it is trying to get the right answer.

So, it could be that the youth saving survey is also plausible. Or not. Hard to tell, really. And that’s before you dig into what “saving for something” might mean — is it actual money-in-the-bank or a New Year’s resolution.

September 8, 2012

Mammogram risks?

Stuff has excellent coverage of a new research paper finding possible risks of mammograms in women under 30 with rare mutations in two specific genes involved in DNA repair (including repair to DNA damage caused by X-rays).

It’s important to stress that the risk findings don’t apply to people in general: X-rays do increase cancer risk for everyone, but only by a tiny amount.  A study published in June this year caused concern by estimating that for every 10,000 CT scans in kids under 10 years old, two cancers would be caused.  That’s a 2 in 10000 additional risk per scan: the additional risk estimated in the breast cancer study is hundreds of times larger.

September 7, 2012

Natural division of labour

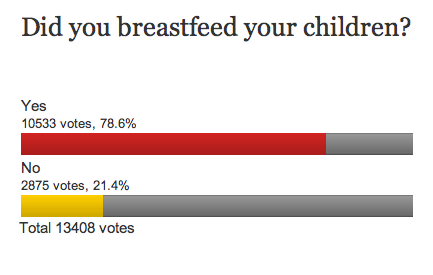
From one of the current clicky polls over on Stuff, some surprising results:

In a representative sample of NZ parents I would have thought the ‘Yes’ figure would have to be at most 50%.

The question is an example of where the passive voice can be an improvement: “Were your children breastfed?” 


NRL Predictions, Finals Week 1

Team Ratings for Finals Week 1

Here are the team ratings prior to Finals Week 1, along with the ratings at the start of the season. I have created a brief description of the method I use for predicting rugby games. Go to my Department home page to see this.

Current Rating Rating at Season Start Difference
Bulldogs 6.56 -1.86 8.40
Cowboys 6.40 -1.32 7.70
Sea Eagles 6.21 9.83 -3.60
Rabbitohs 5.51 0.04 5.50
Storm 5.38 4.63 0.80
Raiders 1.41 -8.40 9.80
Knights 0.01 0.77 -0.80
Dragons -0.37 4.36 -4.70
Broncos -0.53 5.57 -6.10
Sharks -1.17 -7.97 6.80
Titans -2.20 -11.80 9.60
Wests Tigers -2.74 4.52 -7.30
Roosters -5.43 0.25 -5.70
Panthers -6.45 -3.40 -3.00
Warriors -8.08 5.28 -13.40
Eels -8.25 -4.23 -4.00


Performance So Far

So far there have been 192 matches played, 115 of which were correctly predicted, a success rate of 59.9%.

Here are the predictions for last week’s games.

Game Date Score Prediction Correct
1 Knights vs. Rabbitohs Aug 31 6 – 18 1.10 FALSE
2 Broncos vs. Panthers Aug 31 19 – 12 11.07 TRUE
3 Titans vs. Sea Eagles Sep 01 16 – 24 -3.13 TRUE
4 Wests Tigers vs. Storm Sep 01 6 – 26 -0.51 TRUE
5 Bulldogs vs. Roosters Sep 01 42 – 10 13.54 TRUE
6 Sharks vs. Cowboys Sep 02 22 – 36 -0.99 TRUE
7 Warriors vs. Raiders Sep 02 22 – 42 -2.13 TRUE
8 Eels vs. Dragons Sep 02 8 – 29 -0.03 TRUE


Predictions for Finals Week 1

Here are the predictions for Finals Week 1

Game Date Winner Prediction
1 Bulldogs vs. Sea Eagles Sep 07 Bulldogs 4.90
2 Cowboys vs. Broncos Sep 08 Cowboys 11.40
3 Raiders vs. Sharks Sep 08 Raiders 7.10
4 Storm vs. Rabbitohs Sep 09 Storm 4.40


September 6, 2012

The genomic 99%

Today was the release of phase 2 of the ENCODE project, the effort to catalogue all the stuff in the human genome that isn’t genes.  This is a big deal: nearly all our DNA isn’t genes, and ENCODE is a big step towards figuring out what, if anything, it does. (HeraldStuff have the Associated Press story, New York Times has more, Nature has some good news and comment articles).

Our chromosomes spend nearly all their time curled into little tangles, and some of the ENCODE experiments looked at which bits of the DNA are actually accessible on the outsides of these tangles. Other experiments measured where ‘transcription factors’, which turn genes on and off, attach to DNA. Others looked at which bits of DNA get transcribed into RNA by cells. For complete information, these experiments need to be done for the whole genome, and because the behaviour of DNA is different in every cell type, for many types of cells.  That’s only partially been done, and the project is going to contact indefinitely (or at least as long as they can get money — so far they have spent the equivalent of three full years of the NZ Health Research Council budget, or about 2% of the cost of the Large Hadron Collider).

The headline finding in the news stories is that about three-quarters of the genome can sometimes get copied from the DNA ‘reference’ version to temporary RNA.  We used to think that essentially all RNA copies were from genes, and were made for the purpose of translating the RNA into protein.   Over the years, it has become clear that there’s a lot more varied RNA around than can be explained by making proteins, but ENCODE’s results are much more extreme than expected (by me, at least).  We don’t know what most of the non-gene RNA does, and it’s possible that some of it doesn’t do anything, but some of it must do interesting things that we have no clue about.

ENCODE itself was a great opportunity primarily for US researchers, but the ENCODE results are an opportunity for the whole world, and New Zealand scientists will be looking for ways to take advantage of all this new data.

September 5, 2012

Lotto and abstract theory

There is a recurring argument in statistics departments around the world about how much abstract theory should be taught to students, and how much actual applied statistics. One of the arguments in favour of theory, even for students who are being trained to do applied data analysis, is that theory gives you a way to substitute calculation for thought. Thinking is hard, so we try to save it for problems where it is needed.

The current top Google hit for “big wednesday statistics” offers a nice illustration.  It’s a website selling strategies to increase your chance of winning, based on a simple message

If you play a pattern that occurs only five percent of the time, you can expect that pattern to lose 95 percent of the time, giving you no chance to win 95 percent of the time. So, don’t buck the probabilities.

For example,

When you select your lotto numbers, try to have a relatively even mix of odd and even numbers. All odd numbers or all even numbers are rarely drawn, occurring only one percent of the time. The best mix is to have 2/4, 4/2 or 3/3, which means two odd and four even, or four odd and two even, or three odd and three even. One of these three patterns will occur in 83 percent of the drawings.

Now, if you understand how the lottery is drawn and know some basic probability, you can tell that this advice can’t possibly work, without even reading it carefully. But if you had to explain the fallacy to someone, it might take a bit of thought to locate it.  If 99% of wins are have a mixture of odd and even (actually, more like 98%), why doesn’t that make it bad to choose all odd or all even?

When you have an answer (or have given up), click through for more:

(more…)