Posts from August 2012 (64)

August 19, 2012

Big Data is watching you

Or, as some of my colleagues would prefer “Big Data are watching you”.  In Stuff.   The story is about the potential disadvantages of your life being predictable by sophisticated analysis, and it’s pretty good.

I will comment on one example:

The Corrections Department first developed a computer system, RocRol, in 1995 that calculates the chances of prisoners being reconvicted within five years of their release…

Corrections analyst Arul Nadesu told a conference at Te Papa in February that new software developed by business analytics firm SAS that incorporates neural networking technology – a technique for processing data that mimics the way signals are passed between neurons in the brain – could reduce the risk of RocRol “misclassifying” an offender to just one in seven.

The software may be new, but neural networks for prediction have been around since the 1960s, when people did really believe that they mimicked the way the brain works. Neuroscience has come a long way since then.  Neural networks were very popular in the 1980s, but by the time I learned about them in the early 1990s they were no longer anything special or distinctive.

Also reduce the risk … to just one in seven” suggests that it’s substantially worse than one in seven at the moment. While things may change in the future, that’s exactly the current problem with Big Data: the predictions aren’t all that good


August 17, 2012

More for support than illumination

StatsChat has been mentioned again by National Business Review, though they attribute StatsChat to Stats New Zealand.  They are using my post on cybercrime to attack the proposed internet anti-bullying laws.   Personally, I’m not convinced my post supports their argument, but you can judge that for yourselves.

One thing I will point out: that $625 million cybercrime number that I criticized and that they are now disparaging? They used it in a headline as recently as June.


August 16, 2012

Probabilistic weather forecasts

For the Olympics, the British Meterology Office was producing animated probabilistic forecast maps, showing the estimated probability of various amounts of rain or strengths of wind at a fine grid of locations over Britain.  These are a great improvement over the usual much more vague and holistic predictions, and they were made possible by a new and experimental high-resolution ensemble forecasting system.  (via)

I will quibble slightly about the probabilities in the forecast, though.  The Met Office generates a set of predictions spanning a reasonable range of weather models and input uncertainties, and then says “80% change of rain” if 80% of the predictions have rain at that location.   That is, 80% means an 80% chance that a randomly chosen prediction will say “rain”, it doesn’t necessarily mean that “out of locations and hours with 80% forecast probability, 80% of them will actually get rain”.

It’s possible to improve the calibration of the probabilities by feeding the ensemble of predictions into a statistical model, and researchers at the University of  Washington have been working on this.  Their ProbCast page gives probabilistic rain and temperature forecasts for the state of Washington that are based on a statistical model for the relationship between actual weather and the ensemble of forecasts, and this does give more accurate uncertainty numbers.

Attack of the killer eggyolk

The Herald tells us

Eating eggs yolks is almost as bad for your heart as smoking, new research suggests.

This one is not really the fault of the newspaper: that is what the researchers suggest, though it is not really what the research suggests.

 Researchers analysed lifestyle data from over 1200 men and woman aged about 60 who were attending a vascular prevention clinic in London. 

So we’re looking at patients who had been referred to a special clinic because of suspected atherosclerosis, not a representative sample (and that’s London, Ontario, not the better-known one slightly west of the Olympic stadium).

The researchers asked patients about egg consumption and smoking (but did ask for or didn’t use anything else about diet or exercise).  They found that patients with a lot of atherosclerotic plaque in their carotid arteries tended to be older, more likely to smoke, and more likely to eat eggs.   How much more likely? Well, the ‘almost as bad’ is seriously understating the association they found.  If their results are correct, eating one egg yolk has more than ten times the effect on carotid plaque of smoking one cigarette.  The estimates don’t look that extreme at first glance, because they count consumption in egg yolks per week, and packs of cigarettes per day.

This is the sort of situation where it’s important to look at what is already known.  There is a big US cohort study following up nurses and doctors, which didn’t find any adverse effects of egg consumption.  Short-term experimental studies with controlled diets have had mixed results.  A few other long-term studies have found heart disease effects specifically in diabetics, but only 11% of the people in this study were diabetics.

It’s possible that eggs increase heart disease risk, especially in diabetics, but the results of this study seem too extreme to be explained by a real risk.  Another possibility is that when you ask people about egg consumption, what you get is the number of times per week they consume a good solid traditional breakfast, where eggs are not the only dietary risk factor present.

Exactly 100 million pi (roughly)

The US Census Bureau estimates that the population of the United States reached π×100 million on Tuesday afternoon (US time): 314,159,265. (via Stuff)

There’s no margin of error with this estimate, which might seem surprising from a respected national statistics agency.  The reason is that there is no sampling error in the estimate, all the uncertainty is from non-sampling errors.   The Census Bureau started with the 2010 US Census counts, subtracted deaths and emigrations (me, for example) and added births and immigrations.  In principle, the data on all these is complete and no sampling is used.  That doesn’t mean there isn’t any error — far from it — but it does make it very hard to estimate how much error there is.

The ubiquity of non-sampling error, and the impossibility of estimating it accurately, explain why surveys in New Zealand are about the same size as surveys in the USA, despite the huge difference in population.   In theory, you could afford to collect larger samples in the US, so US statistical agencies could get more precise estimates than Stats New Zealand can afford.  In practice, once surveys get to a certain size, the non-sampling error starts to be more important than the sampling error, and extra sample size stops giving you much increase in accuracy.

August 15, 2012

Is that a kiwi in your pocket?

Stuff has a story based on the latest release from the “Mega Kiwi Sex Survey”, covering all sorts of headline-worthy topics such as infidelity rates, and major turn-ons and turn-offs.

Conducting an accurate and reliable sex survey is difficult: both in taking the sample and in persuading people to give honest answers.  It’s much easier not to bother with all that.  We’ve commented adversely on the Durex Sex Survey before, but that at least made real attempts to get a representative sample.  Durex hired Harris Interactive, who are probably the leaders in trying to get reliable data out of online surveys.

The Mega Kiwi survey, not so much.  The producers say (update: most links here NSFW)

Fitzgerald says they are aiming to capture data from a broad cross section of New Zealanders “We’re working with a couple of key partners to get their audiences to take part, but we’re really trying to build a complete picture of the New Zealand sexual identity, so whether you’re a 60-year-old male in Eketahuna or a 22-year-old female in Ponsonby, we want to hear from you.”

and that’s how they went about it. A little Googling finds some of the links to the online survey form.  It’s a typical bogus poll.

Even if it were a real poll, the sample size of 1500 wouldn’t justify quoting results to the nearest tenth of a percentage point, since the margin of error would be about 2.5%.    In fact, the news release gives numbers to a tenth of a percent even for Gisborne.  Gisborne has about 1% of the Kiwi population, so a representative sample would have just 15 Gisborne respondents.

Still, the real point of the survey is to get news coverage rather than having to pay for advertising.  It seems to have worked.

Real petrol prices

From Stuff

BP spokesman Jonty Mills said as prices neared uncharted territory it was likely demand would drop. The outlook for prices remained volatile, he said.

An Automobile Association spokesman, Mark Stockdale, said prices were now “perilously close” to a record, which typically prompted a review of driving options and habits.

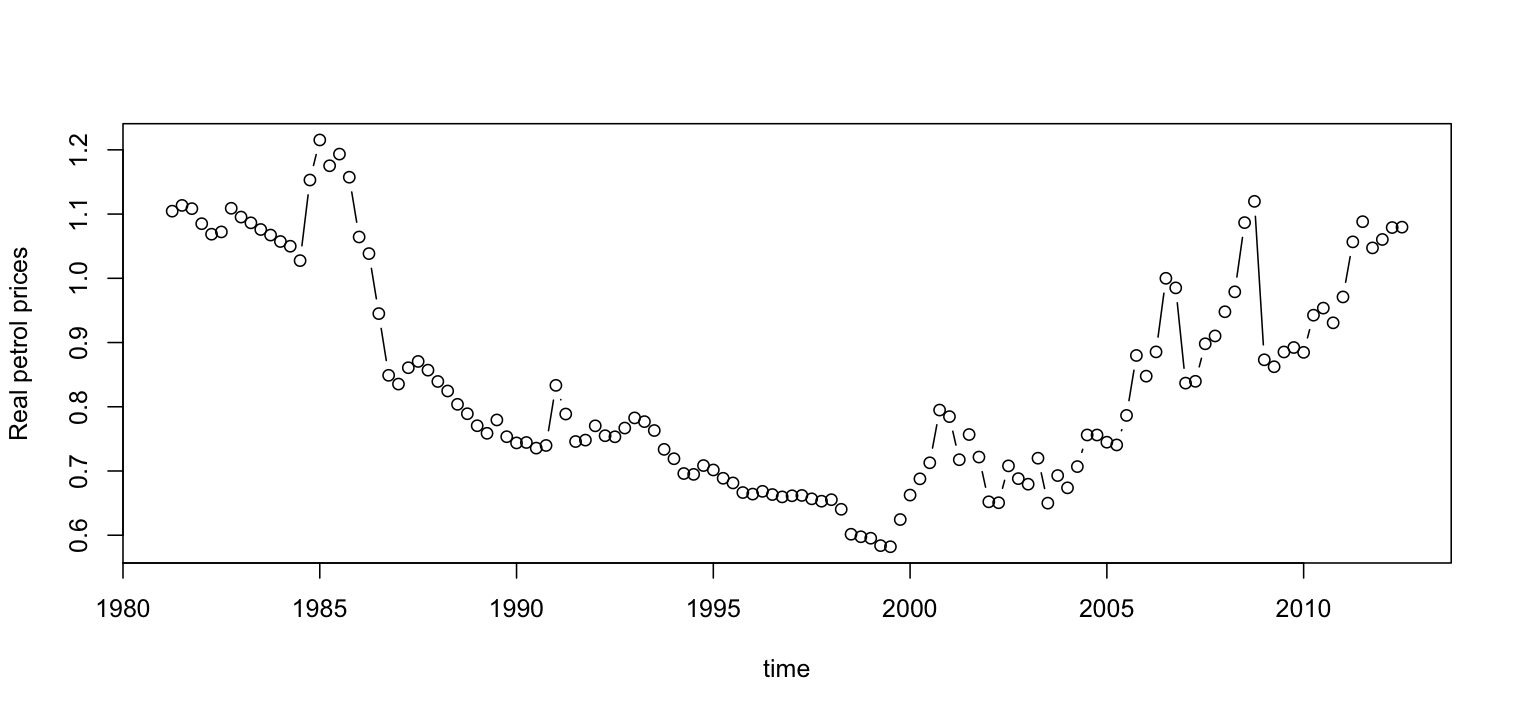
As usual this is talking about nominal prices, not inflation-adjusted, so the real prices aren’t really as ‘perilously close’ to a record as all that.  Dividing the StatsNZ petrol price index by CPI we get:

Prices are much lower than in 1985,  and still safely below the more recent 2008 peak.  The record that is in peril is the little wiggle in prices from last year.

On the other hand, prices are up at the levels of the 1980s (though with much cheaper cars), so driving really is getting more expensive.  A “review of driving options and habits” might be a good idea


How the Aussies topped the medal table (sort of) …

Wit from the Sydney Morning Herald:

How Australia topped the medal tally

Who was the real winner from the London Olympic Games? According to a ground-breaking analysis of the official medal tally by a BusinessDay statistician, the most successful nation at the Olympics was … Australia!

Statistics can be used to tell a lot more than one story, of course. Other nations will try to claim victory using lesser formulations. Based on the number of athletes per medal, for example, China will claim it is the winner. Despite occasional murmurs of complaint at being fleeced out of gold, the Peoples’ Republic needed just 4.5 athletes to win a medal of any colour.

From its team of 396 athletes, the Chinese needed 10 athletes to win each of their gold medals. Next best among the top 25 nations at the Olympics was the US, which needed 12 athletes for each gold and 5.1 athletes for all medals. The American team was by far the biggest with 530 athletes.

The 410-strong Australian squad required 12 athletes for a medal, and 59 athletes for each gold medal. It has been well publicised that the 2012 Olympics were a bit lacking on the gold medal front, at least by Australia’s historical standards. Naturally, the proponents of sports funding are therefore calling on government to dig deep – to buy some more medals at the next Games.

Read the rest here.

NRL Predictions, Round 24

Team Ratings for Round 24

Here are the team ratings prior to Round 24, along with the ratings at the start of the season. I have created a brief description of the method I use for predicting rugby games. Go to my Department home page to see this.

Current Rating Rating at Season Start Difference
Bulldogs 8.79 -1.86 10.70
Cowboys 4.98 -1.32 6.30
Sea Eagles 4.67 9.83 -5.20
Storm 4.36 4.63 -0.30
Rabbitohs 4.05 0.04 4.00
Knights 2.18 0.77 1.40
Wests Tigers -0.05 4.52 -4.60
Broncos -0.18 5.57 -5.70
Titans -0.33 -11.80 11.50
Sharks -1.90 -7.97 6.10
Raiders -2.38 -8.40 6.00
Warriors -3.50 5.28 -8.80
Dragons -3.76 4.36 -8.10
Eels -5.10 -4.23 -0.90
Roosters -6.44 0.25 -6.70
Panthers -9.12 -3.40 -5.70


Performance So Far

So far there have been 168 matches played, 97 of which were correctly predicted, a success rate of 57.74%.

Here are the predictions for last week’s games.

Game Date Score Prediction Correct
1 Rabbitohs vs. Sea Eagles Aug 10 6 – 23 2.50 FALSE
2 Storm vs. Titans Aug 10 24 – 16 9.42 TRUE
3 Eels vs. Roosters Aug 11 36 – 22 4.28 TRUE
4 Wests Tigers vs. Dragons Aug 11 22 – 12 7.87 TRUE
5 Cowboys vs. Warriors Aug 11 52 – 12 7.83 TRUE
6 Panthers vs. Raiders Aug 12 10 – 20 -0.76 TRUE
7 Bulldogs vs. Broncos Aug 12 22 – 14 14.51 TRUE
8 Knights vs. Sharks Aug 13 26 – 4 6.03 TRUE


Predictions for Round 24

Here are the predictions for Round 24

Game Date Winner Prediction
1 Broncos vs. Storm Aug 17 Storm -0.00
2 Bulldogs vs. Wests Tigers Aug 17 Bulldogs 13.30
3 Raiders vs. Roosters Aug 18 Raiders 8.60
4 Sharks vs. Rabbitohs Aug 18 Rabbitohs -1.50
5 Titans vs. Eels Aug 19 Titans 9.30
6 Warriors vs. Panthers Aug 19 Warriors 10.10
7 Sea Eagles vs. Knights Aug 19 Sea Eagles 7.00
8 Dragons vs. Cowboys Aug 20 Cowboys -4.20


August 14, 2012

London 2012 and data journalism: What did we learn at the Olympics?

Fascinating item in The Guardian, which looks at the Olympics from a data journalist’s point of view …. and does a great job.