Posts from July 2012 (55)

July 9, 2012

Kiwi workers say “don’t know” to more migrants?

Or perhaps not. It’s hard to tell.

The Herald’s headline is “Kiwi workers say ‘no’ to more migrants”, with the reported data apparently being on ethnic diversity in the workplace, rather than migration

  • 27% want more
  • 33% want less
  • 40% not sure

Now, the difference between 27% and 33% is smaller than the margin of sampling error based on 200 NZ respondents (and much smaller than the usual ‘maximum margin of error’ calculation), but that’s not the main issue.

Another problem is that “More migrants” is not the same as “more ethnic diversity”, and it’s certainly not the same as “more non-English-speaking background”, which the story also mentions.  (I’m a migrant, I’m from an English-speaking background, and I don’t think preferring Aussie Rules to rugby is the sort of ethnic diversity they had in mind).

More important, though, is the question of whether this is a real survey or a bogus poll.   The story doesn’t say.  If you ask the Google, it points you to a webpage where you can participate in the survey,

In order to continue to provide the most current insights into our modern workplace we need your valuable input.

which is certainly an indicator of bogosity.

On the other hand, Leadership Management Australasia, who run the survey, also give some summary reports.  One report says

The survey design and implementation is overseen by an experienced, independent research practitioner and the systems and process used to conduct the survey ensure valid, reliable and representative samples.

which seems to argue for a real survey (though not as convincingly as if they’d actually named the independent research practitioner).   So perhaps the self-selected part of the sample isn’t all of it, and perhaps they do some sensible reweighting?

If you look at the demographic profile of the survey, though, at least two-thirds of the participants are male, even at the non-managerial level.  Now, in both NZ and Australia, male employment is higher than female, but it’s not twice as high.  The gender profiles are definitely not representative.  So even if the survey is making some efforts to be a representative sample, it isn’t succeeding.


[Updated to add: in case it’s not clear, in the last paragraph, I’m talking about the summary report for second quarter 2011]
July 8, 2012

Genetic variants and health – what are the links?

How do genetic variants affect biology and health? Is personalised medicine just around the corner?

Thomas Lumley, prolific statschat.org.nz contributor and University of Auckland biostatisician, gives a primer to Kim Hill and her listeners on Radio New Zealand.

July 6, 2012

Where does it all go?

In yesterday’s Herald story about alcohol consumption the superficial flaws hid a much more important inaccuracy.

The survey says:

“Of the 113,345,000 glasses of alcohol consumed in New Zealand between February last year and January this year, 28 per cent were drunk by men older than 50,”

Now, Stats New Zealand reports alcohol sales each year, and they say we bought 300 million litres of beer, 100 million litres of wine, and 70 million litres of spirits last year, totalling 33 million litres of pure alcohol.  To make the numbers add up, there would need to be about 290ml of pure alcohol (over 24 standard drinks) in each glass. At most two standard drinks per glass might be realistic as an average, so that’s off by a factor of more than 10  (in a statistic given to six significant figures).

Some of the alcohol would have been consumed by people under 18, who weren’t in the survey, but if they drink 90% of the alcohol sold in NZ we aren’t panicking nearly enough.  Some of it would have been sold to foreigners, and some discarded, but again there’s no way that adds up to 90%.

In fact, the number is implausible on its face: there’s 4.5 million people in NZ, and there must be at least 3 million over 18. That would give an average of only three drinks per month for adult Kiwis.

Even other survey data doesn’t agree. As I pointed out last week, the NZ  Alcohol and Drug Use Survey finds 26% of the adult population drinks more than twice per week. Just those people must rack up more than 113 million glasses per year.

Either someone has lost a decimal place somewhere, or survey respondents lie to Roy Morgan even more than they lie to government researchers.

July 5, 2012

Denominators yet again

Tony Cooper, in a Stat of the Week nomination, point us to the Herald’s headline

“Men over 50 nation’s biggest drinkers”

When you look at the body of the text, though, the data only say that men over 50, in aggregate, drank more than the other subgroups of the population.  That’s somewhat relevant if you are planning a sales campaign, in which case the Roy Morgan report might be useful.  It doesn’t tell you which group are the biggest drinkers, because that depends on per-person alcohol consumption.

As two of the experts actually quoted in the story said, men over 50 accounted for the largest chunk of the booze because there are a lot of men over 50, not because they are the heaviest drinkers.  A little simple arithmetic shows that, per person, men over 50 drank less than men 35-50, and less than men 25-34.  Not doing the arithmetic is one thing, but it really doesn’t look good when the headline also directly contradicts what your sources are quoted as telling you.

Counting deaths from power outages

The last big power blackout in the US, before this week’s one, was in 2003 in New York.  There’s a new paper out that estimates how many deaths it caused, and discussion at Simply Statistics.

At the time, the official report was 6 deaths, mostly due to carbon monoxide poisoning.  However, the number of deaths from all causes was 28% higher than usual, which implies an extra 90 deaths (obviously, with some uncertainty).

We don’t know which of the deaths during that period were caused by the power outage, but these “statistical deaths” were just as much real people as the 6 whose deaths were officially recognised.

The genome is big. Really big.

And to prove it, Yonder Biology is streaming the genome over the course of a year.  As you may remember from earlier posts, there are about 30 million seconds in a year, and 3 billion bases in the genome, so that comes to 100 bases per second for the entire year. (via)

July 4, 2012

Physicists using statistics

Traditionally, physics was one of the disciplines whose attitude was “If you need statistics, you should have designed a better experiment”.  If you look at the CERN webcast about the Higgs Boson, though, you see that it’s full of statistics: improved multivariate signal processing, boosted decision trees, random variations in the background, etc, etc.

Increasingly, physicists have found, like molecular biologists before them, and physicians before that, that sometimes you can’t afford to do a better experiment. When your experiment costs billions of dollars, you really have to extract the maximum possible information from your data.

As you have probably heard by now, CERN is reporting that they have basically found the Higgs boson: the excess production of certain sets of particles deviates from a non-Higgs model by 5 times the statistical uncertainty: 5σ.  Unfortunately, a few other sets of particles don’t quite match, so combining all the data they have 4.9σ, just below their preferred threshold.

So what does that mean?  Any decision procedure requires some threshold for making a decision.  For drug approval in the US, you need two trials that each show the drug is more effective than placebo by twice the statistical uncertainty: ie, two replications of 2σ, which works out to be a combined exceedance by 2.8 times the statistical uncertainty: 2.8σ.  This threshold is based on a tradeoff between the risk of missing a treatment that could be useful and the risk of approving a useless drug.  In the context of drug development this works well — drugs get withdrawn from the market for safety, or because the effect on a biological marker doesn’t translate into an effect on actual health, but it’s very unusual for a drug to be approved when it just doesn’t work.

In the case of particle physics, false positives could influence research for many years, so once you’ve gone to the expense of building the Large Hadron Collider, you might as well be really sure of the results.  Particle physics uses a 5σ threshold, which means that in the absence of any signal they have only a 1 in 30 million chance per analysis of deciding they have found a Higgs boson.    Despite what some of the media says, that’s not quite the same as a 1 in 30 million chance of being wrong: if nature hasn’t provided us with  a 125GeV Higgs Boson, an analysis that finds the result has a 100% chance of being wrong, if there is one, it has a 0% chance of being wrong.


Sincerest form of flattery

Thanks to the Google, while tracking down a specific phrase from a StatsChat post I found another site with a remarkably similar dialogue.  The main change is that the participants have been given names, implying a previously unreported interest in 21st century New Zealand accident statistics by the famous Russian probabilist Andrey Markov (who died in 1922).

[if the site goes offline, I have a screenshot]

Lazy scientific fraud

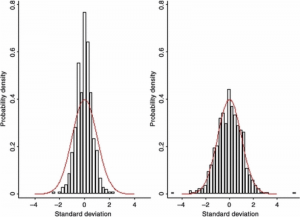
If you toss a coin 20 times, you will get 10 heads on average.  But if someone claims to have done this experiment 190 times and got exactly 10 heads of out 20 every single time they are either lying or a professional magician.

An anaesthesiology researcher, Yoshitaka Fujii, has the new record for number of papers retracted in scientific journals: 172 and counting. The fakery was uncovered by an analysis of the results of all his published randomized trials, showing that they had an unbelievably good agreement between the treatment and control groups, far better than was consistent with random chance.  For example, here’s the graph of differences in average age between treatment and control groups for Fujii’s trials (on the left) and other people’s trials (on the right), with the red curve indicating the minimum possible variation due only to chance.

The problem was pointed out more than ten years ago, in a letter to one of the journals involved, entitled “Reported data on granisetron and postoperative nausea and vomiting by Fujii et al. are incredibly nice!”  Nothing happened.  Perhaps a follow-up letter should have been titled “When we say ‘incredibly nice’, we mean ‘made-up’, and you need to look into it”.

Last year, Toho University, Fujii’s employer, did an investigation that found eight of the trials had not been approved by an ethics committee (because they hadn’t, you know, actually happened). They didn’t comment on whether the results were reliable.

Finally, the journals got together and gave the universities a deadline to come up with evidence that the trials existed, were approved by an ethics committee, and were reported correctly.  Any papers without this evidence would be retracted.

Statistical analysis to reveal fraud is actually fairly uncommon.  It requires lots of data, and lazy or incompetent fraud: if Prof Fujii had made up individual patient data using random number generators and then analysed it, there would have been no evidence of fraud in the results.   It’s more common  to see misconduct revealed by re-use or photoshopping of images, by failure to get ethics committee approvals, or by whistleblowers.  In some cases where the results are potentially very important, the fraud gets revealed by attempts to replicate the work.

NRL Predictions, Round 18

Team Ratings for Round 18

Here are the team ratings prior to Round 18, along with the ratings at the start of the season. I have created a brief description of the method I use for predicting rugby games. Go to my Department home page to see this.

Current Rating Rating at Season Start Difference
Storm 9.09 4.63 4.50
Bulldogs 6.13 -1.86 8.00
Sea Eagles 5.70 9.83 -4.10
Broncos 4.04 5.57 -1.50
Warriors 3.49 5.28 -1.80
Rabbitohs 2.33 0.04 2.30
Cowboys 1.96 -1.32 3.30
Wests Tigers 1.59 4.52 -2.90
Sharks 0.18 -7.97 8.20
Titans -2.35 -11.80 9.50
Dragons -2.51 4.36 -6.90
Knights -3.68 0.77 -4.50
Roosters -5.28 0.25 -5.50
Raiders -7.64 -8.40 0.80
Panthers -8.16 -3.40 -4.80
Eels -8.64 -4.23 -4.40


Performance So Far

So far there have been 122 matches played, 72 of which were correctly predicted, a success rate of 59.02%.

Here are the predictions for last week’s games.

Game Date Score Prediction Correct
1 Broncos vs. Sharks Jun 29 12 – 26 12.62 FALSE
2 Eels vs. Knights Jun 30 12 – 20 0.97 FALSE
3 Warriors vs. Cowboys Jul 01 35 – 18 3.93 TRUE
4 Rabbitohs vs. Panthers Jul 01 38 – 12 12.89 TRUE
5 Raiders vs. Dragons Jul 02 22 – 18 -1.51 FALSE


Predictions for Round 18

Here are the predictions for Round 18

Game Date Winner Prediction
1 Wests Tigers vs. Bulldogs Jul 06 Bulldogs -0.00
2 Storm vs. Raiders Jul 07 Storm 21.20
3 Titans vs. Warriors Jul 07 Warriors -1.30
4 Rabbitohs vs. Knights Jul 08 Rabbitohs 10.50
5 Sea Eagles vs. Eels Jul 08 Sea Eagles 18.80
6 Sharks vs. Roosters Jul 09 Sharks 10.00