Posts from April 2012 (50)

April 13, 2012

What’s wrong with this picture?

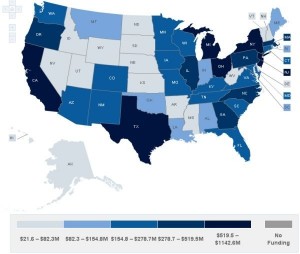
It’s not just the NZ media that has problems with denominators.  This graph from the Washington Post shows where US Federal health reform money is being spent.  And, surprise, surprise, there’s more money being spent in states with large populations.

The map is actually from the Kaiser Family Foundation, and they even have a cute interactive version that lets you look at different subcategories of funding.  What they don’t let you do is standardize by any useful denominator: population, health care expenditure,…   They do let you look at the map both in dollars and in fraction of the total, but, not surprisingly, it looks exactly the same on both scales.

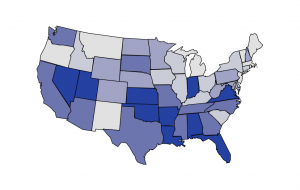
Fortunately it isn’t hard to find the populations of US states, and R lets us draw pretty maps.  Below is the same map coloured according to per-capita Federal health reform funding, which looks almost completely different.

The facts speak for themselves?

Two headlines based on the same data from QV.  In the Herald

Auckland house values soar

and in Stuff

House prices ease in March

And it’s not just the sub-editor’s fault; the headlines match the text of the story in both cases.

April 12, 2012

NRL Predictions, Round 7

Team Ratings for Round 7

Here are the team ratings prior to Round 7, along with the ratings at the start of the season. I have created a brief description of the method I use for predicting rugby games. Go to my Department home page to see this.

Current Rating Rating at Season Start Difference
Storm 9.74 4.63 5.10
Sea Eagles 7.20 9.83 -2.60
Broncos 6.81 5.57 1.20
Dragons 3.45 4.36 -0.90
Knights 1.19 0.77 0.40
Rabbitohs 0.96 0.04 0.90
Bulldogs 0.92 -1.86 2.80
Warriors 0.28 5.28 -5.00
Wests Tigers -0.56 4.52 -5.10
Cowboys -1.85 -1.32 -0.50
Roosters -2.09 0.25 -2.30
Sharks -2.81 -7.97 5.20
Panthers -3.15 -3.40 0.30
Raiders -3.92 -8.40 4.50
Eels -8.20 -4.23 -4.00
Titans -11.71 -11.80 0.10

Performance So Far

So far there have been 48 matches played, 25 of which were correctly predicted, a success rate of 52.08%.

Here are the predictions for last week’s games.

Game Date Score Prediction Correct
1 Rabbitohs vs. Bulldogs Apr 06 20 – 10 3.50 TRUE
2 Wests Tigers vs. Broncos Apr 06 14 – 18 -2.65 TRUE
3 Titans vs. Roosters Apr 07 12 – 18 -4.95 TRUE
4 Sharks vs. Dragons Apr 07 12 – 0 -4.37 FALSE
5 Raiders vs. Warriors Apr 08 32 – 12 -3.45 FALSE
6 Knights vs. Eels Apr 08 14 – 6 15.01 TRUE
7 Cowboys vs. Storm Apr 08 18 – 42 -3.87 TRUE
8 Sea Eagles vs. Panthers Apr 09 30 – 0 11.97 TRUE


Predictions for Round 7

Here are the predictions for Round 7

Game Date Winner Prediction
1 Dragons vs. Knights Apr 13 Dragons 6.80
2 Broncos vs. Raiders Apr 13 Broncos 15.20
3 Storm vs. Bulldogs Apr 14 Storm 13.30
4 Roosters vs. Cowboys Apr 14 Roosters 4.30
5 Sea Eagles vs. Titans Apr 14 Sea Eagles 23.40
6 Warriors vs. Rabbitohs Apr 15 Warriors 3.80
7 Sharks vs. Eels Apr 15 Sharks 9.90
8 Panthers vs. Wests Tigers Apr 15 Panthers 1.90


Super 15 Predictions, Week 8

Team Ratings for Week 8

Here are the team ratings prior to Week 8, along with the ratings at the start of the season. I have created a brief description of the method I use for predicting rugby games. Go to my Department home page to see this.


Current Rating Rating at Season Start Difference
Bulls 8.39 4.16 4.20
Crusaders 7.12 10.46 -3.30
Stormers 6.80 6.59 0.20
Chiefs 2.03 -1.17 3.20
Waratahs 1.39 4.98 -3.60
Hurricanes 0.70 -1.90 2.60
Blues 0.20 2.87 -2.70
Sharks -0.22 0.87 -1.10
Cheetahs -1.33 -1.46 0.10
Highlanders -2.64 -5.69 3.00
Reds -2.79 5.03 -7.80
Force -4.10 -4.95 0.90
Brumbies -5.85 -6.66 0.80
Lions -9.88 -10.82 0.90
Rebels -13.14 -15.64 2.50


Performance So Far

So far there have been 48 matches played, 32 of which were correctly predicted, a success rate of 66.7%.
Here are the predictions for last week’s games.

Game Date Score Prediction Correct
1 Rebels vs. Blues Apr 05 34 – 23 -12.60 FALSE
2 Hurricanes vs. Sharks Apr 06 43 – 18 1.70 TRUE
3 Reds vs. Brumbies Apr 06 20 – 13 7.70 TRUE
4 Force vs. Chiefs Apr 06 12 – 20 -0.40 TRUE
5 Highlanders vs. Stormers Apr 07 6 – 21 -3.00 TRUE
6 Cheetahs vs. Lions Apr 07 26 – 5 11.50 TRUE
7 Bulls vs. Crusaders Apr 07 32 – 30 6.50 TRUE


Predictions for Week 8

Here are the predictions for Week 8. The prediction is my estimated points difference with a positive margin being a win to the home team, and a negative margin a win to the away team.


Game Date Winner Prediction
1 Blues vs. Sharks Apr 13 Blues 4.90
2 Force vs. Waratahs Apr 13 Waratahs -1.00
3 Crusaders vs. Stormers Apr 14 Crusaders 4.80
4 Brumbies vs. Rebels Apr 14 Brumbies 11.80
5 Cheetahs vs. Chiefs Apr 14 Cheetahs 1.10
6 Lions vs. Bulls Apr 14 Bulls -13.80


April 11, 2012

Tooth nuking

The Herald (and media sources worldwide) is covering a research paper on brain tumours and dental x-rays.  The paper asked roughly 1500 people with meningioma, and the same number of healthy people, about their histories of dental X-rays.  The people with meningiomas were more likely than the controls to report having X-rays at least annually, and the researchers estimated a relative risk of 1.5.

Now, meningioma is pretty rare, so this increase works out to an extra lifetime risk of maybe 5 cases for each 10,000 people.  Also, if you are going to have a brain tumour, meningioma is the one to have — some are not even diagnosed, and most diagnosed ones are treated successfully.  On the other hand, brain tumours are usually something you’d like to avoid, so is the risk real?

There are at least two issues that make the relative risk of 1.5 less plausible

  • Self-report of risk factors for cancer is notoriously unreliable
  • Since meningiomas can be relatively minor, the time of diagnosis varies, there might be some tendency for the sort of people who have regular dental x-rays to also be the sort of people who get earlier diagnoses, which would show up as a higher rate

The Science Media Centre also has a good summary, with quotes from experts.

It’s interesting to work out whether the risk increase is in the right ballpark given general knowledge about radiation.  A 1991 paper looked at the dose from different sorts of bite-wing dental X-ray setups, and found a range from 2 microSievert to 20 microSievert.   (XKCD shows what a microSievert means).   The same paper quotes an estimated risk of 0.73 health events including cancers per Sievert of dose to a population.   We don’t know what the population size was, but we can get a rough idea from the original paper.  They found 1500 meningiomas in 5 years, so at a rate of 3 per 100,000 people per year, that means about ten million people.  Roughly a third of the controls (and so roughly a third of the population) had at least yearly X-rays, so let’s suppose we are looking at 20 x-rays exposure on average for this third of people.Multiplying all the numbers together gives about 150 extra health events at 20 microSieverts per X-ray, or about 40 at the more-typical modern value of 5 microSieverts per X-ray.  The 1.5 relative risk that the researchers found is larger than this crude extrapolation would predict, but the order of magnitude is right.

So, there may well be a small increase in risk of a rare, mostly treatable brain tumour from having yearly dental x-rays.  It’s uncertain how big the risk is, and there are reasons to expect it might be less than a 1.5-fold increase, but that increase is at least of a plausible order of magnitude.   The radiation exposure from a dental x-ray is quite a bit less than from a trans-Tasman flight, and hugely less than from a CT scan, but it’s not zero.
April 9, 2012

Stat of the Week Competition Winner: March 31-April 6 2012

Thanks for all the nominations this week – they were all fantastic. We have awarded the winner to be Luis Apiolaza’s nomination of “between 246 and 1,476 people in Palmerston North not addressing their gambling problem.” The notion of spurious accuracy is well worth publicizing. Congratulations Luis!

‘Causal’ is not enough

Yesterday’s post about crime rates and liquor stores was tagged ‘correlation vs causation’, but it’s more complicated than that.  It’s not even clear what sort of causation is at stake.

I think we can all agree that being drunk, like being young and male, is a causal factor in violent crime. But that’s not the question.  There are two possible causal stories behind higher crime rates near liquor stores, or, more precisely, alcohol licenses.   These are truly causal alternatives to the skeptical argument that it’s actually (demand for) drinking that leads to alcohol licenses.

The weaker causal story is that people get drunk, and when they do, they are more likely to do it nearer to alcohol licenses.  That’s certainly the case for pubs and restaurants — if you buy beer from a pub, you are going to be drinking it at the pub  — and could be true for liquor stores as well.   This story would say that if you moved an alcohol license the crime would move, and if you shut down one place, the drunkenness and crime would relocate among the available options.  If this is true, it’s useful to local community groups wanting to improve local conditions, but it’s pretty much useless from a public health and safety viewpoint.

The stronger story is that people won’t drink if they have to go further to get alcohol, so that reducing the number of licenses will reduce drinking.   On this theory, reducing licenses could have a health and safety impact beyond just local redistribution of crime.

It’s not possible to distinguish these using the available data.  There’s good evidence that something like the first story holds for CCTV installation — it pushes crime out of the surveillance zone but doesn’t stop it.  And there’s some evidence that something like the second explanation works for stopping kids from smoking — adding inconvenience and cost has much more of an impact on them than on adults.

The future needs statisticians

The current issue of the journal Science has an editorial on the importance of statistics, and on the increased demand for statisticians in the `Big Data’ future.  The writers, Marie Davidian and Tom Louis, call out the need for increased funding in graduate programs — it hasn’t kept up with inflation, let alone with demand.

They also note

The future demands that scientists, policy-makers, and the public be able to interpret increasingly complex information and recognize both the benefi ts and pitfalls of statistical analysis. It is a good sign that the new U.S. Common Core K-12 Mathematics Standards introduce statistics as a key component in precollege education, requiring that students be skilled in describing data, developing statistical models,making inferences, and evaluating the consequences of decisions.

Here, at least, New Zealand is ahead of the game.

Stat of the Week Competition: April 7-13 2012

Each week, we would like to invite readers of Stats Chat to submit nominations for our Stat of the Week competition and be in with the chance to win an iTunes voucher.

Here’s how it works:

  • Anyone may add a comment on this post to nominate their Stat of the Week candidate before midday Friday April 13 2012.
  • Statistics can be bad, exemplary or fascinating.
  • The statistic must be in the NZ media during the period of April 7-13 2012 inclusive.
  • Quote the statistic, when and where it was published and tell us why it should be our Stat of the Week.

Next Monday at midday we’ll announce the winner of this week’s Stat of the Week competition, and start a new one.


The fine print:

  • Judging will be conducted by the blog moderator in liaison with staff at the Department of Statistics, The University of Auckland.
  • The judges’ decision will be final.
  • The judges can decide not to award a prize if they do not believe a suitable statistic has been posted in the preceeding week.
  • Only the first nomination of any individual example of a statistic used in the NZ media will qualify for the competition.
  • Employees (other than student employees) of the Statistics department at the University of Auckland are not eligible to win.
  • The person posting the winning entry will receive a $20 iTunes voucher.
  • The blog moderator will contact the winner via their notified email address and advise the details of the $20 iTunes voucher to that same email address.
  • The competition will commence Monday 8 August 2011 and continue until cancellation is notified on the blog.

Stat of the Week Competition Discussion: April 7-13 2012

If you’d like to comment on or debate any of this week’s Stat of the Week nominations, please do so below!