Posts from March 2012 (64)

March 19, 2012

Stat of the Week Competition: March 17-23 2012

Each week, we would like to invite readers of Stats Chat to submit nominations for our Stat of the Week competition and be in with the chance to win an iTunes voucher.

Here’s how it works:

  • Anyone may add a comment on this post to nominate their Stat of the Week candidate before midday Friday March 23 2012.
  • Statistics can be bad, exemplary or fascinating.
  • The statistic must be in the NZ media during the period of March 17-23 2012 inclusive.
  • Quote the statistic, when and where it was published and tell us why it should be our Stat of the Week.

Next Monday at midday we’ll announce the winner of this week’s Stat of the Week competition, and start a new one.

(more…)

March 18, 2012

The Demon Drink

On 3 News last night, we got a tour of South Auckland, just missing various drunken disturbances.   The video starts “3News has uncovered some shocking figures about the amount of alcohol some offenders are drinking” , and the webpage story says  “new research has revealed the alarming impact alcohol is having on crime“.

That’s approximately truish.  The `new research’ is a report dated December 2010 by the New Zealand Drug Use Monitoring (NZ‐ADUM) research programme at Massey University.  They surveyed 800 arrestees in Whangarei, Auckland Central, Wellington Central, and Christchurch Central, asking them about their drug and alchol use.   And there was a lot of drug and alcohol use — evidently, police arrests are selecting for people who are insufficiently risk-averse in all sorts of ways.  The figures possibly qualify as ‘shocking’, with arrestees reporting an average of 12 standard drinks both on typical days when they drink, and on the day they were arrested.  Some people reported much higher consumption, and some reported none.

3News compares this to “The average New Zealander drinks around two standard drinks a day”, which looks like this StatsNZ figure on total alcohol sales.  In addition to the problems of comparing self-reported drinking with sales data, the national average is over all days and the arrestee average is over days when they drank.  Since the arrestees reported drinking an average of about 1 day in 3, the correct comparison to 2 drinks/day is 12/3=4 drinks per day, about twice the NZ average.    The arrestees also consumed more tobacco, more cannabis, more P, more opioids, more ecstasy, and more of everything else than the average Kiwi; in fact, as far as I can tell alcohol showed a smaller difference than any of the other drugs — mostly because the average for all New Zealanders is fairly high.

The other notable statistic about drinking is that the average drinks per day that they drank was the same as the average drinks on the day they were arrested.  That is, although many of the arrestees were drunk when they were arrested, they were no drunker than they usually are on about one day in three.   The relative risk of arrest given their heavy drinking for these arrestees is thus about 3, which is a lot smaller than I would expect even without the headlines.  If you read the report, while alcohol is unquestionably a problem, it is far from the only problem that the arrestees have.



March 17, 2012

Faster-than-light neutrinos don’t replicate

This isn’t in the NZ media yet, but it will probably turn up soon.  A second CERN experiment, ICARUS,  has repeated the measurement of neutrino speed made by the famous OPERA experiment: the same neutrino source, the same distance, but different measurement equipment.   And the neutrinos arrived on-time, not 60ns early. Since the OPERA results violate relativity  and have other practical and theoretical problems , it’s not that hard to decide which set of numbers to believe.

As Prof. Matt Strassler says

This is the way it works in science all the time. A first experiment makes a claim that they see a striking and surprising effect. A second experiment tries to verify the effect and instead shows no sign of it. It’s commonplace. Research at the forefront of knowledge is much more difficult than people often realize, and mistakes and flukes happen on a regular basis. When something like this happens, physicists shrug and move on, unruffled and unsurprised.

 That’s why replication, reproducibility, and peer review are so important in science.  If your experiments are easy to run correctly and straightforward to interpret, you obviously aren’t working at the cutting edge.

Stat of the Week Competition Discussion: March 17-23 2012

If you’d like to comment on or debate any of this week’s Stat of the Week nominations, please do so below!

March 16, 2012

Blink, and you’ll miss it

It’s not often that you see a special interest group make a claim about the economic impact of their chosen problem and think “I never imagined it could be so small”.

Today is, apparently, World Sleep Day, and we have a problem

A quarter of New Zealanders have a chronic sleep problem, according to the World Association of Sleep Medicine.

 That’s 15% with insomnia and `up to’ 9% with sleep apnea.  The  sleep docs go on to say

Studies by the World Association of Sleep Medicine show sleep disorders cost New Zealand at least 40 million dollars a year in lost productivity

A quarter of (working-age) New Zealanders is a bit under a million people, so that’s an average of about a buck a week, or about five minutes per sufferer per week at minimum wage.   Can lack of sleep really be that unimportant economically, or has someone dropped a decimal place somewhere?

The $8 billion iPod

Actual numbers from entertainment industry lawyers and lobbyists form the basis for this, frankly, unbelievable talk about Copyright Math(TM).

http://www.ted.com/talks/rob_reid_the_8_billion_ipod.html

While this talk may seem amusing, the figures he quotes are used to justify all sorts of real world implications for you and I. The Copyright (Infringing File Sharing) Amendment Act came into power last year, the US Embassy attempted to write Section 92A for New Zealand, and now new trade agreements are being negotiated.

Next time you see unbelievable claims, specifically of a numerical nature, question the figures.

And remember to insure your music collection. It’s worth billions.

March 15, 2012

NRL Predictions, Round 3


Team Ratings for Round 3

Here are the team ratings prior to Round 3, along with the ratings at the start of the season. I have created a brief description of the method I use for predicting rugby games. Go to my Department home page to see this.

Current Rating Rating at Season Start
Sea Eagles 9.70 9.83
Warriors 5.68 5.28
Broncos 4.78 5.57
Storm 4.71 4.63
Wests Tigers 3.84 4.52
Dragons 2.35 4.36
Knights 1.35 0.77
Bulldogs 1.18 -1.86
Rabbitohs -0.98 0.04
Roosters -1.30 0.25
Panthers -2.06 -3.40
Cowboys -2.63 -1.32
Eels -5.64 -4.23
Raiders -6.88 -8.40
Sharks -7.43 -7.97
Titans -10.40 -11.8

Performance So Far

So far there have been 16 matches played, 8 of which were correctly predicted, a success rate of 50%.

Here are the predictions for the games so far.

Game Date Score Prediction Correct
1 Knights vs. Dragons Mar 01 14 – 15 0.91 FALSE
2 Eels vs. Broncos Mar 02 6 – 18 -5.30 TRUE
3 Raiders vs. Storm Mar 03 19 – 24 -8.53 TRUE
4 Panthers vs. Bulldogs Mar 03 14 – 22 2.96 FALSE
5 Cowboys vs. Titans Mar 03 0 – 18 14.98 FALSE
6 Warriors vs. Sea Eagles Mar 04 20 – 26 -0.05 TRUE
7 Wests Tigers vs. Sharks Mar 04 17 – 16 16.99 TRUE
8 Rabbitohs vs. Roosters Mar 05 20 – 24 4.29 FALSE
9 Sea Eagles vs. Wests Tigers Mar 09 22 – 18 11.56 TRUE
10 Broncos vs. Cowboys Mar 09 26 – 28 14.56 FALSE
11 Titans vs. Raiders Mar 10 12 – 24 3.45 FALSE
12 Bulldogs vs. Dragons Mar 10 30 – 4 -0.99 FALSE
13 Sharks vs. Knights Mar 11 6 – 18 -2.81 TRUE
14 Roosters vs. Panthers Mar 11 0 – 18 9.69 FALSE
15 Storm vs. Rabbitohs Mar 11 24 – 10 9.47 TRUE
16 Eels vs. Warriors Mar 12 20 – 36 -5.07 TRUE


Predictions for Round 3

Here are the predictions for Round 3

Game Date Winner Prediction
1 Dragons vs. Wests Tigers Mar 16 Dragons 3.00
2 Knights vs. Broncos Mar 16 Knights 1.10
3 Titans vs. Storm Mar 17 Storm -10.60
4 Cowboys vs. Eels Mar 17 Cowboys 7.50
5 Warriors vs. Bulldogs Mar 18 Warriors 9.00
6 Roosters vs. Raiders Mar 18 Roosters 10.10
7 Panthers vs. Rabbitohs Mar 18 Panthers 3.40
8 Sharks vs. Sea Eagles Mar 19 Sea Eagles -12.60

Super 15 Predictions, Week 4


Team Ratings for Week 4

Here are the team ratings prior to Week 4, along with the ratings at the start of the season. I have created a brief description of the method I use for predicting rugby games. Go to my Department home page to see this.

Current Rating Rating at Season Start
Crusaders 7.65 10.46
Stormers 6.03 6.59
Bulls 5.17 4.16
Waratahs 3.99 4.98
Reds 3.29 5.03
Blues 2.99 2.87
Sharks 1.31 0.87
Chiefs 0.63 -1.17
Hurricanes 0.31 -1.90
Highlanders -3.22 -5.69
Cheetahs -4.36 -1.46
Force -6.44 -4.95
Brumbies -6.82 -6.66
Lions -9.78 -10.82
Rebels -14.08 -15.64


Performance So Far

So far there have been 21 matches played, 12 of which were correctly predicted, a success rate of 57.1%.
Here are the predictions for the games so far.

Game Date Score Prediction Correct
1 Blues vs. Crusaders Feb 24 18 – 19 -3.10 TRUE
2 Brumbies vs. Force Feb 24 19 – 17 2.80 TRUE
3 Bulls vs. Sharks Feb 24 18 – 13 7.80 TRUE
4 Chiefs vs. Highlanders Feb 25 19 – 23 9.00 FALSE
5 Waratahs vs. Reds Feb 25 21 – 25 4.40 FALSE
6 Stormers vs. Hurricanes Feb 25 39 – 26 13.00 TRUE
7 Lions vs. Cheetahs Feb 25 27 – 25 -4.90 FALSE
8 Chiefs vs. Blues Mar 02 29 – 14 -0.70 FALSE
9 Rebels vs. Waratahs Mar 02 19 – 35 -15.40 TRUE
10 Lions vs. Hurricanes Mar 02 28 – 30 -3.90 TRUE
11 Highlanders vs. Crusaders Mar 03 27 – 24 -10.40 FALSE
12 Reds vs. Force Mar 03 25 – 20 15.10 TRUE
13 Cheetahs vs. Bulls Mar 03 19 – 51 -1.40 TRUE
14 Stormers vs. Sharks Mar 03 15 – 12 10.00 TRUE
15 Crusaders vs. Chiefs Mar 09 19 – 24 14.70 FALSE
16 Force vs. Hurricanes Mar 09 19 – 46 2.50 FALSE
17 Brumbies vs. Cheetahs Mar 10 24 – 23 2.20 TRUE
18 Highlanders vs. Waratahs Mar 10 18 – 17 -3.40 FALSE
19 Reds vs. Rebels Mar 10 11 – 6 25.10 TRUE
20 Sharks vs. Lions Mar 10 32 – 20 16.30 TRUE
21 Bulls vs. Blues Mar 10 23 – 29 9.10 FALSE


Predictions for Week 4

Here are the predictions for Week 4. The prediction is my estimated points difference with a positive margin being a win to the home team, and a negative margin a win to the away team.

Game Date Winner Prediction
1 Chiefs vs. Brumbies Mar 16 Chiefs 11.90
2 Stormers vs. Blues Mar 16 Stormers 7.50
3 Hurricanes vs. Highlanders Mar 17 Hurricanes 8.00
4 Waratahs vs. Force Mar 17 Waratahs 14.90
5 Sharks vs. Reds Mar 17 Sharks 2.50
6 Rebels vs. Cheetahs Mar 18 Cheetahs -5.20


Two for the price of one

Roy Morgan have released their “State of the Nation” report, and the Herald has two stories. In the first

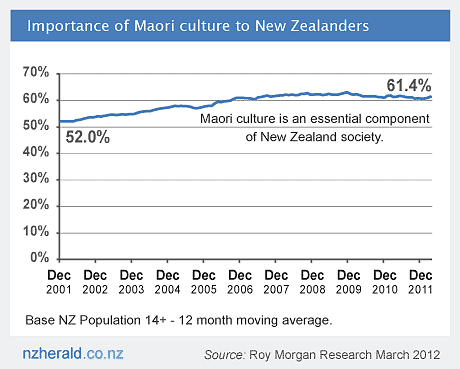
According to the Roy Morgan State of the Nation March 2012 report, there has been an upsurge in the number of New Zealanders who consider Maori culture to be an “essential component” of New Zealand society.

 If a change from 52% to 61% is an upsurge, then yes, but the upsurge happened from 2001-2005.  Since 2006, the proportion has been flat at over 60%, as is clear from the Herald’s own graph:

The other story says that most of NZ wealth is now  held by over-55s.

the 55-plus group has increased its share of net wealth from 43 per cent in 2002 to 52 per cent last year.

that is, by about a quarter

Their share of the population also rose in the same period, but only from 19.5 per cent to 24.7 per cent.

or, about a quarter.   Based on these numbers, in 2002, the average net wealth for people over 55 was about 2.2 times higher than the average for everyone over 14, and it’s now about 2.1 times higher.  Since the story goes on to say

The value of their own homes accounted for 56 per cent of their wealth a decade ago, and 70 per cent last year.

presumably the ratio for non-home wealth is even less favorable to the over-55s.


Significant imperfections in cancer screening

The Herald did a good job itself in providing statistics to put today’s front-page story in context

BREAST CANCER

2700 number of new cases in 2008

624 number of deaths in 2008

8: number of women who had something unspecified wrong with their diagnosis, for reasons we don’t give, having unknown impact on their future health, in circumstances that are still being investigated but might not be exciting enough for the front page if we wait for the facts.