Posts from March 2012 (64)

March 31, 2012

Statistics New Zealand Digital Yearbooks

Statistics New Zealand has been undertaking the task of digitising their Yearbooks, dating back to 1893. The digitisation is not simple scanning which would not allow the easy copying of data.

One method of obtaining data which I have tested and appears to work satisfactorily is to use Excel 2010. Go to the Data tab, and select From Web. In the address box give the address of the page containing the table you wish to import. (For example from the 1893 Yearbook, I chose the page with the address http://www3.stats.govt.nz/New_Zealand_Official_Yearbooks/1893/NZOYB_1893.html#id333C618.) Then go to the table you want, click on the Yellow Arrow as directed, and you have your table in Excel.

I was alerted to this project by the interview last Saturday by Kim Hill of Claire Stent from Statistics New Zealand. You can get a podcast or listen to this by going to http://www.radionz.co.nz/national/programmes/saturday/20120324.

I would nominate this project for Stat of the Week, but I don’t think I am eligible.

March 30, 2012

Powerball and the Kelly criterion

A popular decision rule for investment and other forms of gambling is the Kelly criterion, named after mathematician (and successful investor) John Kelly.  In the long run, following this rule will maximise long-run expected wealth.

If we assume that the story in Stuff about Wairarapa bettors having had a 2:1 return in the past year can be applied to tomorrow’s Powerball (which it can’t), we can look at what that would imply about rational betting.

The Kelly criterion specifies what fraction of your total wealth you should spend on an investment opportunity.  The fraction is always less than your probability of winning.  With 2:1 expected payoff and large odds, the recommended fraction is about half the probability of winning

The chance of the top Powerball prize (since this isn’t a ‘must win’ week) is 1 in 38 million for a $1 bet, so you should bet less than 1 dollar for each 76 million dollars of your current disposable wealth.   For most of us, that’s less than one dollar.

It’s worth noting that while not everyone supports the Kelly criterion, most of the critics suggest that you should bet less than the criterion recommends, not more.

(via a commenter at Cornell physics blog The Virtuosi)

Traffic congestion and data science

Recently, I mentioned the possibility of using bus timing data to probe congestion on Auckland roads.  This idea has been bypassed by Google, who now provide real-time congestion maps of New Zealand using smartphone location data.

If you run Google Maps or Google Navigation, you have the option of sending anonymous GPS-based location data to Google, so they know the locations of lots of phones.  By tracking the speed of phones that are moving along roads, they can work out the traffic speed, and measure congestion.   This is harder than it sounds — GPS accuracy on its own is not enough to distinguish phones in cars from phones carried by pedestrians — but using combined location and speed data they can even give separate congestion information in each direction on many roads.

For example, if you were coming to our public lecture on Tuesday, you might look on Google Maps and click on the “Traffic” label, and see that Symonds St is totally clogged, and decide to come up Grafton Rd instead.

NRL Predictions, Round 5

Team Ratings for Round 5

Here are the team ratings prior to Round 5, along with the ratings at the start of the season. I have created a brief description of the method I use for predicting rugby games. Go to my Department home page to see this.

Current Rating Rating at Season Start Difference
Storm 8.03 4.63 3.40
Sea Eagles 7.57 9.83 -2.30
Broncos 6.55 5.57 1.00
Dragons 4.90 4.36 0.50
Warriors 3.85 5.28 -1.40
Knights 1.86 0.77 1.10
Bulldogs 1.31 -1.86 3.20
Rabbitohs 0.00 0.04 -0.00
Wests Tigers -0.01 4.52 -4.50
Panthers -0.96 -3.40 2.40
Cowboys -1.66 -1.32 -0.30
Roosters -3.87 0.25 -4.10
Raiders -4.38 -8.40 4.00
Sharks -4.87 -7.97 3.10
Eels -10.58 -4.23 -6.30
Titans -11.49 -11.80 0.30


Performance So Far

So far there have been 32 matches played, 16 of which were correctly predicted, a success rate of 50%.

Here are the predictions for last week’s games.

Game Date Score Prediction Correct
1 Eels vs. Panthers Mar 23 6 – 39 0.19 FALSE
2 Rabbitohs vs. Broncos Mar 23 12 – 20 -0.91 TRUE
3 Warriors vs. Titans Mar 24 26 – 6 19.81 TRUE
4 Dragons vs. Sea Eagles Mar 24 17 – 6 0.08 TRUE
5 Cowboys vs. Sharks Mar 24 14 – 20 10.32 FALSE
6 Storm vs. Roosters Mar 25 44 – 4 11.90 TRUE
7 Bulldogs vs. Knights Mar 25 6 – 20 7.37 FALSE
8 Wests Tigers vs. Raiders Mar 26 16 – 30 13.22 FALSE


Predictions for Round 5

Here are the predictions for Round 5

Game Date Winner Prediction
1 Storm vs. Knights Mar 30 Storm 10.70
2 Broncos vs. Dragons Mar 30 Broncos 6.10
3 Panthers vs. Sharks Mar 31 Panthers 8.40
4 Eels vs. Sea Eagles Mar 31 Sea Eagles -13.70
5 Roosters vs. Warriors Mar 31 Warriors -3.20
6 Titans vs. Bulldogs Apr 01 Bulldogs -8.30
7 Wests Tigers vs. Rabbitohs Apr 01 Wests Tigers 4.50
8 Raiders vs. Cowboys Apr 02 Raiders 1.80


Super 15 Predictions, Week 6

Team Ratings for Week 6

Here are the team ratings prior to Week 6, along with the ratings at the start of the season. I have created a brief description of the method I use for predicting rugby games. Go to my Department home page to see this.


Current Rating Rating at Season Start Difference
Bulls 8.89 4.16 4.70
Crusaders 6.90 10.46 -3.60
Stormers 5.71 6.59 -0.90
Waratahs 2.58 4.98 -2.40
Blues 2.09 2.87 -0.80
Sharks 1.65 0.87 0.80
Chiefs 0.23 -1.17 1.40
Hurricanes 0.21 -1.90 2.10
Reds -0.62 5.03 -5.70
Highlanders -2.94 -5.69 2.70
Cheetahs -3.46 -1.46 -2.00
Force -5.61 -4.95 -0.70
Brumbies -5.90 -6.66 0.80
Lions -9.26 -10.82 1.60
Rebels -13.78 -15.64 1.90


Performance So Far

So far there have been 34 matches played, 21 of which were correctly predicted, a success rate of 61.8%.

Here are the predictions for last week’s games.


Game Date Score Prediction Correct
1 Blues vs. Hurricanes Mar 23 25 – 26 7.80 FALSE
2 Rebels vs. Force Mar 23 30 – 29 -4.60 FALSE
3 Waratahs vs. Sharks Mar 24 34 – 30 5.70 TRUE
4 Crusaders vs. Cheetahs Mar 24 28 – 21 16.40 TRUE
5 Brumbies vs. Highlanders Mar 24 33 – 26 0.50 TRUE
6 Bulls vs. Reds Mar 24 61 – 8 6.60 TRUE
7 Lions vs. Stormers Mar 24 19 – 24 -11.50 TRUE


Predictions for Week 6

Here are the predictions for Week 6. The prediction is my estimated points difference with a positive margin being a win to the home team, and a negative margin a win to the away team.


Game Date Winner Prediction
1 Highlanders vs. Rebels Mar 30 Highlanders 15.30
2 Hurricanes vs. Cheetahs Mar 31 Hurricanes 8.20
3 Chiefs vs. Waratahs Mar 31 Chiefs 2.10
4 Brumbies vs. Sharks Mar 31 Sharks -3.10
5 Force vs. Reds Mar 31 Reds -0.50
6 Lions vs. Crusaders Mar 31 Crusaders -11.70
7 Stormers vs. Bulls Mar 31 Stormers 1.30


Lotto silliness

As my good friend and colleague Thomas Lumley points out we have plenty of Lotto-based silliness to tide us over until the next stupid health related press release from a conference with no quality checks. Case-in-point is the article Powerball could be in the stars in Thursday’s NZ Herald (29 March, 2012, A5): (also nominated by Sammie Jia for Stat of the Week).

The article reports the frequency of zodiac signs from a survey of 104 first division Lotto winners, and gleefully touts Taurus as the luckiest star sign with 13% of the total. The article gives us a summary table:

Taurus 13%
Libra 11%
Capricorn 10%
Aquarius 9%
Virgo 9%
Pisces 9%
Leo 8%


Of course, all keen Statschat readers will note that this table does not add up to 100%, nor does it show all twelve zodiac signs, which is not very helpful. Buried in the text is the additional information that Aries and Cancer combined make up 4% of the total.

If we spread the remaining probability over Gemini, Sagittarius and Scorpio, and make the not entirely justified assumption that the distribution of zodiac signs is uniform (which is exactly what the NZ Herald has done), then we can perform a simple chi-squared test of uniformity. This yields a P-value of 0.22, which for most frequentists isn’t exactly compelling evidence.

Being a Bayesian, I prefer to assume multinomial sampling with the prior on the probability of success being uniform. The figure below shows posterior credible intervals (based on 10,000 samples) for the true probability of success. The red dots are the observed values. The dashed line is the equal probability line (0.083 = 1/12).


All of the intervals overlap confirming our statistical intuition that all we are really observing is sampling variation. Yes, Ares and Cancer do fall below the line, but they are not significantly different from the other signs. You can, of course, not believe me – in which case Thomas has some tickets from last week’s draw going very cheap and your chance of winning is almost the same.

March 29, 2012

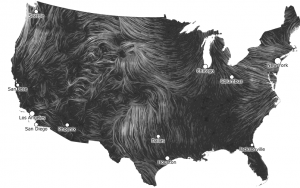
Data visualisations

A flowing wind map of the USA, from hint.fm, who also have other beautiful infographics. Click for the live version

Very like a whale

The Herald has managed to top Stuff’s suggestion that Powerball is in Wairarapa with a story saying it’s “in the stars”.

Of course, they don’t mean the actual stars, they mean European-style astrological birth signs.  Allegedly (and it’s hardly the sort of claim that it’s worth verifying),  15% of winners over the past two years were born under Taurus.   Now, since there are 104 winners and 12 astrological signs, it’s arithmetically unavoidable that some signs will get more winners than others, but how many more would you expect in a typical two-year period?

The easiest way to approximate this is to ignore the fact that slightly more births occur in some months and just sample 104 winners equally from 12 groups.  Repeating this 10,000 times takes a few seconds, and we get a table showing the percentage chance that the most-sampled star sign will have at least 10, 11, 12, … winners.

10 11 12 13 14 15 16 17 18 19
1 100.00 99.70 94.50 76.30 50.50 28.40 14.40 6.30 2.80 1.20

Getting 15% in one group is not at all  surprising.

This still overestimates the surprise: if there hadn’t been an overall pattern, the story could have said that the chance of winning depends on your star sign and on the time of year, for example.    In fact, they did this as well: the second part of the story says that Taurus is lucky now, but that Capricorn will be lucky in a  few weeks.   Of course, the fact that the second part contradicts the first part isn’t mentioned anywhere, and no data are presented to gesture in the direction of evidence for the claim.

We’re very good at seeing patterns, even when they don’t exist, and statistics is one way of ameliorating this problem.

So what is the best time to buy a lottery ticket?  As Scott Adams shows, the day after the drawing — they are a lot cheaper then.

March 28, 2012

Internet congestion

There’s recently been a lot of publicity about the views on internet congestion of a visiting Brit.  Next Tuesday, in Auckland, there’s a public lecture on internet congestion by a different visiting Brit, one who actually knows something about the topic.   Frank Kelly is a Professor of Mathematics at Cambridge, and a Fellow of the Royal Society.  His research is on the design and control of  networks: both abstract ones and concrete ones such as the Internet and the traffic system.

Professor Kelly is visiting the University of Auckland to work with researchers here, and will kick off his visit with the public lecture:

The Internet has attracted the attention of many theoreticians, eager to understand the remarkable success of this diverse and complex artefact. One strand of this effort has been a framework that allows the various detailed algorithms used to control congestion, choose routes and allocate resources to be seen as a distributed mechanism solving a global optimization problem. The talk will review the framework, and discuss topics such as fairness and stability, as well as current engineering efforts to improve the reliability and robustness of the Internet.

 Venue:  Fale Pasifika, University of Auckland (20 Wynyard St, Auckland Central)
Time: 6pm-8pm, Tuesday April 3.

Publishing statistics

Stuff has an interesting story on self-publishing and how e-books and Amazon make it easier.  I’m in favor of anything that produces more good books, but I would like to give two warning notes, one statistical and from my experience, and one non-statistical and from other people’s experience.

The statistical warning note is that most books on Amazon don’t sell much, if at all.  I have a book, a graduate text in a minor area of statistics, for which Amazon gives me sales data.  This book sells 2-4 copies a week through all North American bookstores (and so less than that just through Amazon). Even so, it has never been out of the top 10% of Amazon’s sales rank, it usually is at about the 95th percentile, and sometimes makes it into the top 1%.   Nearly all books on Amazon sell less than this.

The non-statistical warning note is that the self-publishing industry is historically noted for having a lot of scams.  A bit of Google due diligence is useful before you spend money on things.