Explaining risks
Stuff has an article on home birth, including statistics from the Oz & NZ obstetricians (whose policy is uniform disapproval, in contrast to British obstetricians) showing that home birth is more dangerous for the infant.
Getting a good idea of the risks is not easy: you don’t want to compare births that end up at home with those that end up in the hospital, since some births at home were planned to be in the hospital, until something went wrong, and some hospital births were planned to be at home, until something went wrong. You also can’t just compare births where nothing went wrong, since that misses the whole point of risk estimation. The statistics compare women who planned to give birth at home with those who planned to give birth in the hospital (but didn’t have any special risks that would have prevented a home birth). That’s the closest you can get to a fair comparison, though it’s obviously not perfect. In general, people who tend to do what their doctors want also tend to be healthier — even if what their doctors are telling them isn’t actually helpful — and we know that obstetricians want women to give birth in hospital. You could also think of biases in the other direction if you spend a few minutes on it.
However, if the numbers are more or less correct, there’s still the question of how to present them. The obstetricians say the rate of neonatal death was almost three times higher for the women in the studies who planned to have a home birth. The article in Stuff points out that this is 0.15% vs 0.04%, so the absolute risk is small. A better way to present numbers like this is in terms of deaths per 10,000 births. Although the information is the same, there’s a surprisingly large amount of evidence that people understand counts better than proportions, especially small proportions. So: 10,000 pregnant women similar to those in the studies would have about 15 neonatal deaths if they all planned a home birth and about 4 neonatal deaths if they all planned a hospital birth. For context, 10,000 births is all Auckland births for about five months, or all Wellington births for about 18 months.

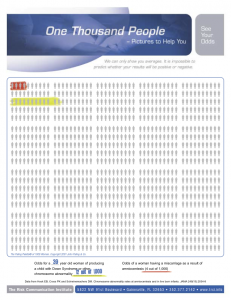
It’s even better to present this sort of information in visual form, using something like the Paling Palettes from the Risk Communication Institute. These allow you to see both absolute and relative risks easily. The example on the left is from their website, and is a pregnancy-related example. On the background of 1000 people are two colored risks. The red is the risk of miscarriage from amniocentesis; the green is the risk of Down Syndrome in a child of a 39-year-old woman.
[Updated to add: of course, you should do the same thing with the various reduced risks for the mothers — the 10,000 planned home births would also prevent nearly 1500 cases of vaginal laceration, about 130 of them serious (3rd degree)]
Thomas Lumley (@tslumley) is Professor of Biostatistics at the University of Auckland. His research interests include semiparametric models, survey sampling, statistical computing, foundations of statistics, and whatever methodological problems his medical collaborators come up with. He also blogs at Biased and Inefficient See all posts by Thomas Lumley »
Another way to express it is that 2 out of 3 babies who die at homebirth would have been saved in the hospital.
13 years ago
That’s true, but it doesn’t tell you anything about the absolute risks, which theoretically should, and empirically does, matter for decision-making.
13 years ago
That’s correct, but within the homebirth community there is the belief that babies who die at homebirth would have died in the hospital anyway. For them, the fact that 2 out of 3 babies who die could have been saved would be surprising news.
13 years ago