Stat of the Week Winner: November 26 – December 2 2011
Thanks for the two nominations for last week’s Stat of the Week competition.
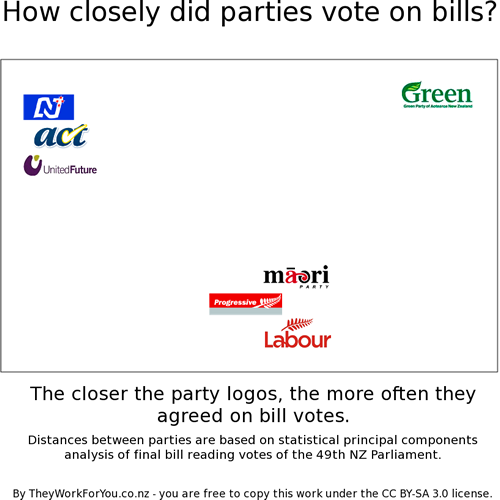
Both were about They Work For You‘s statistical analysis of how the various political parties voted during the last government with a summary graphic:
As both nominations were to the same story, (and it’s quite interesting), we have decided to award it jointly.
It would have been interesting to see a more subtle analysis interpreting the type of bill (and their sign in the PCA) driving the two principal components.
It is not very interesting that Labour and Progressive vote together, but what is separating them from the Greens and from National?
Rachel Cunliffe is the co-director of CensusAtSchool and currently consults for the Department of Statistics. Her interests include statistical literacy, social media and blogging. See all posts by Rachel Cunliffe »
