Posts from November 2011 (34)

November 30, 2011

Half of what?

The sesquipedalian accounting company PwC has a new business fraud report, claiming that half of all NZ businesses have been victims. This is from a survey with 93 Kiwi respondents, including some businesses with even fewer than 200 employees.

The obvious problem is that large businesses have many more employees and are much more likely to have at least one case of fraud.  Small businesses, of which there are many, are vastly under-represented.  A more dramatic example from a few months back was the claim by the US National Retail Federation that 10% of companies it polled had been victims of a ‘flash mob’ attack.   That’s not 10% of stores, that’s 10% of a sample of 106 companies including BP, Sears, and North Face.

The claim that fraud is on the rise could still be supported by the data, as long as the same methodology was used now as in the past, but the reported change from 42% to 49.5% would be well within the margin of error if the 2009 survey was the same size as the new one.

PwC’s Alex Tan explains the rise as “We’re a relatively low-wage economy but we like high-wage living.”  This certainly isn’t a result of the poll — they didn’t poll the perpetrators to ask why they did it — and it sounds rather like the classic fallacy of explaining a variable by a constant.   New Zealand is a relatively low wage country, but we were a relatively low wage country in 2009 as well, and even before that.  Baches are expensive now, but they were expensive in 2009, and even before that.   If low wages and expensive tastes are overcoming Kiwis’ moral fibre this year, how did they resist two years ago?

Averages and diversity

The NZ Herald has a headlineLittle diversity in New Zealand’s average politician“.Of course there’s little diversity in an average — that’s what a one-number summary is for — but the article is mostly about representativeness.

The article says that the typical MP “was a straight European man, from the North Island, aged in his 50s”.  If we compare MPs to other people in full-time employment, we see that they are also most likely to be straight, European, male, and from the North Island, though younger than 50.

The interesting question is which groups are under-represented, and why.   MPs are substantially older than the rest of the employed population. Women are substantially under-represented. Maori are slightly over-represented relative to their population, which is by the design of the electoral system.  Pacific Islanders and Asians are under-represented, by a large enough margin that it’s not entirely due to some migrants only being residents, and so eligible to vote but not to stand for election. And at 95%, straight people are slightly under-represented.


November 28, 2011

Stat of the Week Competition: November 26-December 2 2011

Each week, we would like to invite readers of Stats Chat to submit nominations for our Stat of the Week competition and be in with the chance to win an iTunes voucher.

Here’s how it works:

  • Anyone may add a comment on this post to nominate their Stat of the Week candidate before midday Friday December 2 2011.
  • Statistics can be bad, exemplary or fascinating.
  • The statistic must be in the NZ media during the period of November 26-December 2 2011 inclusive.
  • Quote the statistic, when and where it was published and tell us why it should be our Stat of the Week.

Next Monday at midday we’ll announce the winner of this week’s Stat of the Week competition, and start a new one.

The fine print:

  • Judging will be conducted by the blog moderator in liaison with staff at the Department of Statistics, The University of Auckland.
  • The judges’ decision will be final.
  • The judges can decide not to award a prize if they do not believe a suitable statistic has been posted in the preceeding week.
  • Only the first nomination of any individual example of a statistic used in the NZ media will qualify for the competition.
  • Employees (other than student employees) of the Statistics department at the University of Auckland are not eligible to win.
  • The person posting the winning entry will receive a $20 iTunes voucher.
  • The blog moderator will contact the winner via their notified email address and advise the details of the $20 iTunes voucher to that same email address.
  • The competition will commence Monday 8 August 2011 and continue until cancellation is notified on the blog.
November 27, 2011

It’s over

November 26, 2011

Election Night Graphics

I’ve posted this over on Throng as well, but thought I’d add it here too:

I just saw this graph on TVNZ’s election coverage:

Putting aside the issue of using a perspective graph makes it harder to compare, there’s something wrong with this graph: the informal votes (labelled INF) bar is not correct.

The correct graph should look like this:

Update: there are faint notches in their graphic indicating the “0” mark, however it’s not a clear enough distinction.

November 25, 2011

Facebook data

Well worth a look is Facebook’s data page – they are building platforms to collect, manage and analyse data.

Their most recent update discusses why it appears your friends are more popular than you and the “6 degrees of separation” theory in light of Facebook data:

Using state-of-the-art algorithms developed at the Laboratory for Web Algorithmics of the Università degli Studi di Milano, we were able to approximate the number of hops between all pairs of individuals on Facebook. We found that six degrees actually overstates the number of links between typical pairs of users:

While 99.6% of all pairs of users are connected by paths with 5 degrees (6 hops), 92% are connected by only four degrees (5 hops). And as Facebook has grown over the years, representing an ever larger fraction of the global population, it has become steadily more connected. The average distance in 2008 was 5.28 hops, while now it is 4.74.

November 24, 2011

Interactive map of US road deaths

Zoom in anywhere in the US and see the locations, with icons indicating year and who died.

They also have a UK map, and are interested in expanding to other countries where the data are available.

November 23, 2011

Voting method simulator

Since the election is rapidly approaching, it’s probably a good idea to repost the link to the voting simulator.  Created by Geoffrey Pritchard and Mark Wilson, this allows you to put in proportions of votes and estimate the likely makeup of Parliament under MMP and the four alternatives that are being proposed. There’s also some discussion and a Frequently Asked Questions list.


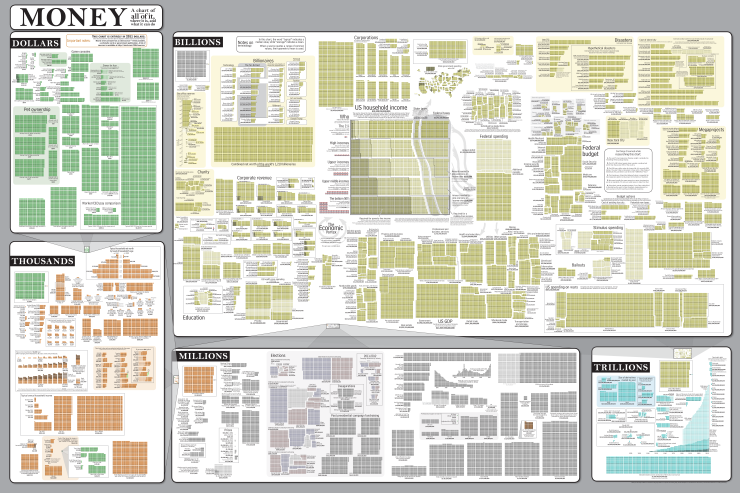
Visualising money

Randall Monroe, at XKCD, has produced another of his amazing charts (click for the full-size version).

Money: a chart of (almost) all of it, where it is, and what it can do.

What do statisticians do all day?

Well, for the past two days, we’ve been listening to our MSc and BSc(Hons) students presenting the results of their research projects.  Here’s a list of titles:

Applying Propensity Scores to Compare Hospital Performance

Order book modelling on the New York Stock Exchange

What Foods are Safe to Eat?

In a Genetic Haystack: Exploring Sparse Microarray Time-Series

Network Meta-Analysis: A Simulation Study and Update

Genome-wide Heterozygosity and Successful Aging in the Cardiovascular Health Study Cohort

Dynamic Advertising Modelling by Implementing Bayesian Forecasting

Occupation-based Socioeconomic Scores: A Path Analysis Approach

Dotcharts in R – What, Whoa and Why

Simulation and Estimation of Stochastic Differential Equations

In or Out? Examining Whether Macroeconomic Variables Help Predict the NZ/US Exchange Rate

Bayesian Estimation of Variance in the Binomial Option Pricing Model

The Introductory Statistics Course: Student Attitudes and Perceived Relevancy

Using Principal Components for the Evaluation Likelihood Ratios for Forensic Trace Evidence

Assessing Genetic Relatedness for Invasive Rats

Hospital Restructuring: was it Harming Us?

Reproducible Research – The Report with Nothing to Hide

Choosing a Transformation or Distance Measure in Ecology: What Do You Throw Away?

Multivariate Extension of ATRIMS Using Copulas with an Application to the Stochastic Volatility Model

A Comparison of Lenth’s Method and APC for the Analysis of Unreplicated Experiments

Constructing Confidence Regions for the Stationary Points of Second Order Response Surfaces

Stepped Wedge Randomised Controlled Trial Design: A Systematic Review and a Case Study

Discrete Choice Modelling with VGAM

Today, the department is running an all-day workshop for high-school teachers.